A Market Timing Report based on the 5-12-2017 Close, published Sunday, May 14, 2017
I deliver focused comments on market timing once or twice a week. These are supplemented with daily “Tweets/StockTwits” (see links below).
UPDATE 5-19-2017: Bounce Attempt Under Way
There is a bounce attempt under way, but the volume behind it is weak across large to small caps. In addition, at least for the SP500 Index, we’re already about half way back to the prior high. I was already well exposed to the market (numbers on social media), so I have not added here, but it’s a possible place to add a bit of exposure if you are underexposed to equities. It’s obviously not the best place to add as volatility has already fallen dramatically off the highs.
The lack of volume at this point can be remedied if more Bulls step up as does happen on some bounces – that is, initially there is a lag in buying and then it kicks in at higher prices. Without that volume, the market is not a great buy at this point…unless as I said you were underexposed to equities in the first place, and then I would add in steps as we may yet retest the low or find a new low based on the immediate news flow. In a Bull market the game is to buy the pullbacks, not chase the highs. Have a plan for these pullbacks and act when they arrive…

Bounce on light volume.
And now back to this week’s issue….
1. SP500 Index: The market has to wonder about President Trump’s ability to move his agenda forward when he is bringing the entire focus of the government and the American people to the firing of James Comey, now the former Director of the FBI. Directory Comey behaved badly prior to the election according to both parties, but the disruption of the ongoing investigation into the Trump election campaign through this firing looks suspicious to most. Trump will have to refocus the nation’s attention elsewhere very quickly or his agenda will likely lose momentum.
Retail sales gains this past month under-performed expectations of a 0.6% increase coming in at 0.4%. It’s still probably good enough for the stock market, which now expects stronger growth through the end of the year. We’d better get it! This was despite the cratering of Macy’s stock on Thursday (minus 17%) and Friday (minus 3%). Amazon and other online businesses are eating Macy’s business up, despite its own efforts to have an online presence. This is a trend that will likely get worse before it levels out into a steady state.
Normally this is “go away in May” time, and looking at the SP500 Index chart below, just coming down off the all time high would be a convenient spot to “go away.” Yet, if growth does come through in the coming quarters, you’ll want to be IN this stock market. If you are market timing the small moves, you’ll have to be nimble, or you’ll miss part of the gains to come.
Continue reading, and I’ll tell you when I will lower my stock market exposure and summarize the “Three Signals” for a further Trump Rally at the end…
Keep up-to-date during the week at Twitter and StockTwits (links below), where a combined 27,053 people are joining in…
Twitter® Follow Me on Twitter®. Follow Me on StockTwits®.
SP500 Large Cap Index (click chart to enlarge; SPX, SPY):
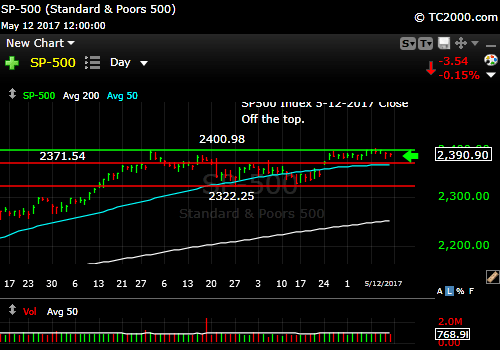
Backing off the high.
Survey Says! Sentiment of individual investors (AAII.com) showed a Bull minus Bear percentage spread of +2.51% vs +8.12% last week. Investors just can’t get excited with the market near all time highs. This is a BIG misunderstanding. Markets that make new highs often head higher not lower. Although the US market has had a good run, I do not believe it is over yet, because there is more growth in the economy ahead. When that reverses, we’ll have to lower our exposure again.
| Thurs. 12 am close to poll | Bulls 32.73% | Neutrals 37.05% | Bears 30.22% |
2. U.S. Small Caps: Small caps indeed gave up their breakout above my “number” noted in the chart below (in white; top left). They are virtually resting on a prior support level as you see on the market timing chart below. As long as this Trump mess does not blow up further, small caps should move higher from here. Any further weakness could bring a lower test to 133ish.
Russell 2000 U.S. Small Cap Index (click chart to enlarge; IWM, RUT):
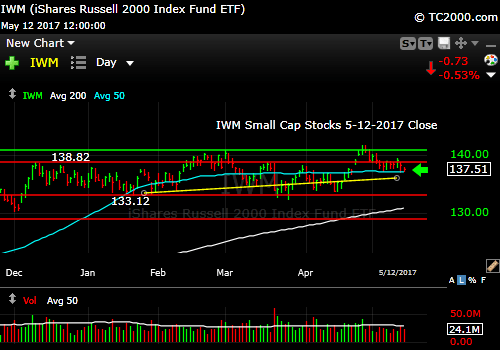
Small caps pulled back to support, below the key breakout number.
3. Gold: Gold is bouncing as rates resume their fall as shown HERE (note the negative market timing correlation of GLD to the 10 year Treasury Yield in yellow). Gold is something you should hold for currency insurance in my view and is not a trading buy at a time when the economy is due to accelerate.
Gold ETF (click chart to enlarge the chart; GLD):
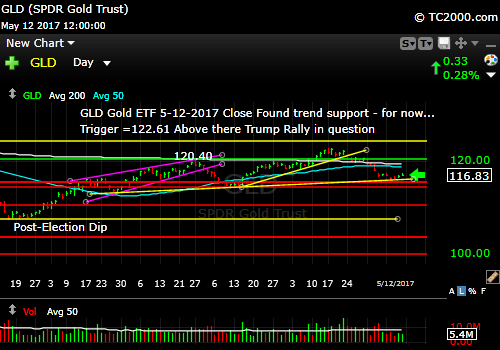
Gold bounces as rates fall once again.
4. U.S. 10 Year Treasury Note Yield (TNX): Rates started falling again at the end of the week breaking the market timing trend as shown in the chart Please note the trigger number in the chart. Below that line, the “Trump Rally” comes back into question.
I am going to keep the same trigger points for both GLD and TNX despite the moves at the end of the weak and the breakdown of the stock signal. The stock signal could switch back on and then off again for all we know until the next trend defines itself. Remember that the game is use market timing parameters to buy the low end of each downward move in a Bull market and this IS very much still a Bull market despite all the warnings you hear.
MY SIGNAL SUMMARY for a Further Trump Stock Market Rally is:
Stock Signal OFF, Gold signal ON, Rate Signal ON.
Again, these signals are close to their switch points and all three must be confirmed to say the Trump Rally is back to a GO.
U.S. 10 Year Treasury Note Yield (click chart to enlarge; TNX, IEF, TYX,TLT,TBF):

Rates break the trend line to the downside again.
Thank you for reading. Would you please leave your comments below where it says “Leave a Reply”… or feel free to ask a question…
Note: My monthly newsletter is now CLOSED to new subscriptions until late this year. I’ll let you know here if and when it reopens.
Be sure to visit the website for more general investing knowledge at:
Standard Disclaimer: It’s your money and your decision as to how to invest it.
I thank Worden Brothers for the charting system I use to post these charts. If you want to know more about the charting system I use every day, go to my “Other Resources” page here: Other Resources It makes it much easier to follow along with me if you can see the charts and manipulate them on your own computer. It’s a great investment to have an excellent charting system. Check it out with a free trial at the link above.
Copyright © 2017 By Wall Street Sun and Storm Report, LLC All rights reserved.
