A Market Timing Report based on the 5-12-2017 Close, published Sunday, May 21, 2017
I deliver focused comments on market timing once or twice a week. These are supplemented with daily “Tweets/StockTwits” (see links below).
UPDATE 5-25-17: Chinese Market Timing Chart Update
Chinese large cap stocks listed in Hong Kong (H Shares; FXI) were up nicely today and are about to test 2015 resistance at 40.59. This progress is being made despite the downgrade of the Chinese credit status by Moody’s. My contention as some of you know is that the Chinese economy must do well to support U.S. economic growth. Chinese stocks are much cheaper still than U.S. stocks, so there’s more upside in valuation and the momentum appears to be building again. The next test will be further proof for the China Bulls should FXI pass it.

Chinese stocks make further progress amid negative credit comments.
Now let’s get back to my previous comments on the U.S. markets, gold, etc…
1. SP500 Index: Market timing is weak when it does not pay attention to economic correlates. As mentioned on Friday, the NY Federal Reserve Bank’s estimate of Q2 GDP (NowCast™) is at 2.3%, up 0.4% from their prior prediction, while the Atlanta Fed moved up from 3.6% on May 12th to 4.1% on May 16th. Keep in mind these predictions are often wildly wrong, although the longer term trends are more reliable than the quarter to quarter estimates.
The Bureau of Economic Analysis take one quarter and attempt to predict the entire year based on a seasonally adjusted look at GDP, a seasonally adjusted annualized rate (a.k.a. “SAAR”). It is NOT reliable to do so. For that reason, some look at annualized averages to smooth the data, while still attending to acceleration/deceleration in the supporting numbers. There is a lot of guesswork in it, and I’ve seen very well-intentioned research groups fall flat on their faces in predicting the last recession that did not happen!
The key question to answer to determine what your equity exposure level should be and to engage in market timing is “Is the economy accelerating or decelerating?” And if it is decelerating, it’s critical to get a sense of whether the deceleration is just a blip or a trend that will lead to recession. Since the last recession, we have had decelerations that are evident in the GDP charts I’ve posted previously, but we never were tipped into a full recession, so the market simply marched higher, most recently based on expectations surrounding the fiscal policies of President Trump.
Here is where we are and then we’ll look at the Clinton impeachment stock market decline. You can see we’ve bounced off a middle level of support within a trading range…
SP500 Large Cap Index (click chart to enlarge; SPX, SPY):
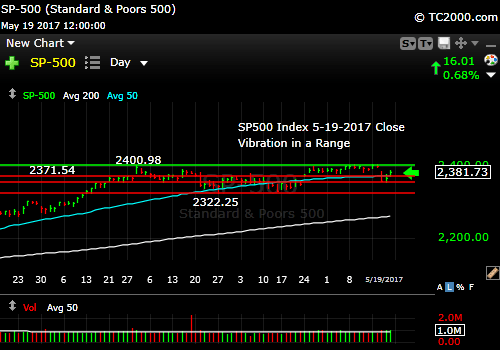
Bouncing in the vibrational range.
Only if the investigations of Trump cause businesses to scale back their plans and decelerate the economy do we have to be concerned about the longer term impact.
Now we need to prepare ourselves with the history of prior presidential impeachments (Bill Clinton was the only one impeached since Andrew Johnson, who was also acquitted by the Senate after impeachment by the House) and presidential resignations (Nixon was the only one to resign, who would have been both impeached by the House and convicted by the Senate had he stuck around for it!).
If you believe Trump’s headed to the exits (I don’t at this point, despite the risk), I would scale back to what would be somewhat lower exposure than you generally have with the idea of adding back after/if we get a 10-20% pullback or more. Nixon left office, but at the time, the economy was a mess unlike now, so the Trump situation is more like Clinton’s than Nixon’s. We saw a 22.45% pullback in the Bill Clinton impeachment as the monthly chart shows…

President Bill Clinton impeachment impact on SP500 Index
Clinton was impeached on December 19th, 1998. He then went to trial in the Senate in early 1999. Note that the market anticipated President Bill Clinton’s acquittal by the Senate almost FOUR MONTHS BEFORE it happened on Feb. 12, 1999. The impeachment of Clinton turned out to be a blip in a big uptrend.
There is a finite and incalculable risk that Trump will be impeached and/or removed from office. My concern for the latter is that Trump is exhibiting behavior that smells a bit like a coverup (firing Comey for ex. and all his defensive Tweets) of what happened instead of stepping forward and cleaning up his administration. That means he himself may have been involved in the collusion that is suspected, though none of this has been proven.
The fact Trump publicly encouraged the Russians to hack the Clinton emails (it’s recorded on video!) certainly makes him suspect, though he could easily claim he was joking to egg the crowds on. The best case is that he’s being defensive, because he’s protecting his guilty people without knowing who they are. In other words, the best case is that he’s just blindly trying to shut down the investigations rather than doing so because evidence can be tracked back to his own involvement.
BOTTOM LINE: If Trump was NOT involved in the Russian interference with our 2016 Election, things will go far easier for the U.S. stock market. There will likely be a few more bumps (dips) along the way and perhaps something a bit more serious such as a mild correction of 5-7%. As we’ve never seen the removal of a President during good economic times, there’s no guidance from history to tell us how the economy would suffer or whether it could simply chug along.
My guess is that either impeachment OR removal of Trump could result in a 20%+ correction/mini-Bear market. Given the current economic picture, we should then recover once the market reassesses the future.
Keep up-to-date during the week at Twitter and StockTwits (links below), where a combined 27,221 people are joining in…
Twitter® Follow Me on Twitter®. Follow Me on StockTwits®.
Survey Says! Sentiment of individual investors (AAII.com) showed a Bull minus Bear percentage spread of -10.40 from +2.51% last week. AAII has found that Neutrals being over 40% is a Bullish finding the vast majority of the time in predicting the level of the market 6 months out. It is one of the strongest predictors they have discovered.
Stay long despite the Trump investigations is my take on it. By the way, a -10%ish Bull minus Bear spread is not that Bearish. Typically moves to minus 20-30% or more mark temporary and important lows. The most important lows have very extreme sentiment readings. We have not seen that. Dip buyers are stepping in on cue.
| Thurs. 12 am close to poll | Bulls 23.85% | Neutrals 41.90% | Bears 34.25% |
2. U.S. Small Caps (IWM,RUT): Small caps never kept their gains above the signal level (top red line) and came close to testing the March market timing low, but not quite. We cannot know how the investigations will inflect the course of the market, but we’ll stick with trading the range at its extremes. Right now, we’re in the middle of the range which is not the place to bite unless you are underexposed to equities. If you are new to this Bull market, you may have to bite every dip you see to participate.
Russell 2000 U.S. Small Cap Index (click chart to enlarge; IWM, RUT):

Still below signal level.
3. Gold (GLD): Gold is not a good bet in times of positive real interest rates that the markets saw coming after Trump was elected, but in times of turmoil, gold regains a bit of shine. I believe this market timing move could be short lived, so trade accordingly and keep a good piece of your profits if you bought lower. Even if gold does well in a period of turmoil leading up to a possible impeachment (not a given), it will have problems thereafter if the economy continues to grow.
Gold ETF (click chart to enlarge the chart; GLD):

Gold bounced further on special prosecutor news.
4. U.S. 10 Year Treasury Note Yield (TNX): It’s fascinating that the 10 Year Treasury Yield tested the market timing “trigger line” I defined several weeks ago (orange line in the chart below). Of course, that line is fairly close to the 4-18-2017 low. If the recovery is still the belief of the market, that trigger line should hold. If not, beware, because the market may have decided that Trump’s agenda is in trouble…
U.S. 10 Year Treasury Note Yield (click chart to enlarge; TNX, IEF, TYX,TLT,TBF):

Rates test the trigger line but bounce.
MY SIGNAL SUMMARY for a Further Trump Stock Market Rally is:
Stock Signal OFF, Gold signal ON, Rate Signal ON.
Again, these signals are close to their switch points and all three must be confirmed to say the Trump Rally is back on track.
Thank you for reading. Would you please leave your comments below where it says “Leave a Reply”… or feel free to ask a question…
Note: My monthly newsletter is now CLOSED to new subscriptions until late this year. I’ll let you know here if and when it reopens.
Be sure to visit the website for more general investing knowledge at:
Standard Disclaimer: It’s your money and your decision as to how to invest it.
I thank Worden Brothers for the charting system I use to post these charts. If you want to know more about the charting system I use every day, go to my “Other Resources” page here: Other Resources It makes it much easier to follow along with me if you can see the charts and manipulate them on your own computer. It’s a great investment to have an excellent charting system. Check it out with a free trial at the link above.
Copyright © 2017 By Wall Street Sun and Storm Report, LLC All rights reserved.
