A Market Timing Report based on the 6-30-2017 Close, published Sunday, July 2nd, 2017
I deliver focused comments on market timing once or twice a week. These are supplemented with daily “Tweets/StockTwits” (see links below).
1. SP500 Index: The economic data continue to be good and stocks are consolidating in a range. Follow the bouncing ball. If the SP500 breaks down below the lower yellow line (see chart below), the odds are good in my view that the green line will be broken in the market timing chart below. As said previously, if that is broken, we’ll be heading to the red line at a minimum. Earnings will have to bear out the guesses at GDP that say we’ll see a fairly strong number in the July 28th report roughly in the range of 2.5-3.0%. The New York Fed only sees 1.9% while the Atlanta Fed’s guess is 2.7%. They are often wildly wrong, but it gives us a rough guide. The Fed is likely to hike rates slowly if growth is in fact below 2%. Earnings will be starting with Pepsi (PEP) on July 11th, which will provide more data on the economy’s performance in Q2.
It’s interesting that the Federal Reserve is not expected to raise rates, even in September with the CME saying the odds are just 12.8% that rates will be bumped up to a 1.25-1.50% target in September 2017 from the current 1.00-1.25% target range. I believe the Federal Reserve WILL raise rates in September if GDP turns out to be in excess of 2.5% for the second quarter. Why? Because it gives them an excuse to normalize rates, which is their intention. If the economy is booming, rates should gradually increase to match the increase in inflation, and the Fed is supposed to stay ahead of that curve to prevent dislocations in the economy.
Keep up-to-date during the week at Twitter and StockTwits (links below), where a combined 28,293 people are joining in…
Twitter® Follow Me on Twitter®. Follow Me on StockTwits®.
Review the chart…
SP500 Large Cap Index (click chart to enlarge; SPX, SPY):

Stocks hesitating in a range.
Survey Says! Sentiment of individual investors (AAII.com) showed a Bull minus Bear percentage spread of +2.85% vs. +3.74% last week. Note the surge in “Neutrals” by about 5% in a week, which means there is a high likelihood of higher SP500 Index prices in 6 months. This is the strongest predictor of market performance that AAII has. It could be many months before the Bears score a win, short of an outside event such as a Trump impeachment (not likely based on current information).
| Thurs. 12 am close to poll | Bulls 29.71% | Neutrals 43.43% | Bears 26.86% |
2. U.S. Small Caps: Our market timing “Stock Signal” is still on as you can see. The small caps remain above the orange trigger line shown in the chart below. This is the time for them to prove that strength is real by taking out the prior all time market timing high of 142.90.
Russell 2000 U.S. Small Cap Index (click chart to enlarge; IWM, RUT):
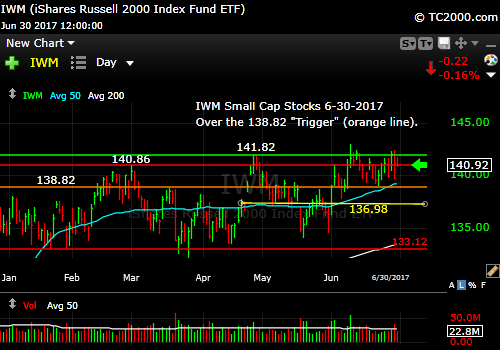
Small caps holding up well despite the tech swoon.
3. Gold: The gold market timing signal is ON, and gold is headed down to test an up trend line. Note that the prior up trend became a possible top with the double top forming at about 123.07.
Still, as long as gold can maintain higher lows, that double top is not insurmountable. The sticking point for gold will likely be strength in the economy accompanied by slowly rising rates. This provides competition for gold. The prime driver for gold is the real rate of return available in other competing assets like stocks and bonds. Review the factors driving gold up and crushing it: “When Does Gold Shine and When Does it Decline?”
Gold ETF (click chart to enlarge the chart; GLD):

Gold has been weak with rates now rising.
4. U.S. 10 Year Treasury Note Yield (TNX): One week changed things. Rates have shot up past that market timing trigger line (orange line in chart below). Banks responded by immediately rallying. XLF was up 2.71% in just the 4 days since rates started rising again. There will be more gains, IF rates continue climbing. Some say inflation will be tame, so rates will collapse again. Others say inflation will pick up with the economy. Take your pick. Or just follow the charts.
Note that rates are testing about the same area vs. the 50 day moving average back in May and then fell. If rates continue upward from here, that would define “a new behavior” for rates, meaning expectations have shifted. If the Fed keeps raising the Fed Funds rate gradually, they may be able to sustain the recovery for many more months however. Then you will see rates stay in a reasonably low range (below 3% longer term). If tax cuts and other fiscal stimulus creates too much inflation in the economy, the 10 year rate will move much higher than 3% (up to 4 or 5% or more; in the mid 1990’s rates spiked above 8% for comparison), and we’ll head into the next recession as the corporate debt overhang comes knocking. A recession is an event worth selling for…
Now let’s review the three market timing signals together….
MY SIGNAL SUMMARY for a Further U.S. Stock Market Rally is:
Stock Signal ON, Gold signal ON (good for stocks, not gold), Rate Signal ON (good for stocks, not bonds).
U.S. 10 Year Treasury Note Yield (click chart to enlarge; TNX, IEF, TYX,TLT,TBF): (ignore the SP500 label)
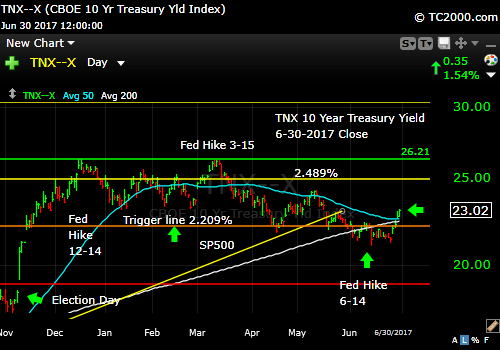
Rates shoot up and drive banks up.
Thank you for reading. Would you please leave your comments below where it says “Leave a Reply”… or feel free to ask a question… Pay it forward too by sending the link to MarketTiming.Blog to a relative or friend. Thank you.
Note: My monthly newsletter is now CLOSED to new subscriptions until late this year. I’ll let you know here if and when it reopens.
Be sure to visit the website for more general investing knowledge at:
Standard Disclaimer: It’s your money and your decision as to how to invest it.
I thank Worden Brothers for the charting system I use to post these charts. If you want to know more about the charting system I use every day, go to my “Other Resources” page here: Other Resources It makes it much easier to follow along with me if you can see the charts and manipulate them on your own computer. It’s a great investment to have an excellent charting system. Check it out with a free trial at the link above.
Copyright © 2017 By Wall Street Sun and Storm Report, LLC All rights reserved.

I have learned a lot from reading this report. Thank you!
Thank you Rob! Sorry for the delay in seeing this! Thanks for reading.