A Market Timing Report based on the 7-28-2017 Close, published Sunday, July 30, 2017
I deliver focused comments on market timing once or twice a week. These are supplemented with daily “Tweets/StockTwits” (see links below).
1. SP500 Index: SP500 earnings have been going well for most US companies in the SP500 Index. Those with problems have been punished, such as Starbucks, down 9.24% on Friday. Per NASDAQ, “Total Q2 earnings for the index are currently expected to be up +9.2% from the same period last year on +5.0% higher revenues.” This includes the 214 companies that have not yet reported as well as those that have. The results put earnings at a record high significantly better in performance than Q1, where earnings actually dipped as shown in the bar graph HERE.
On this past Friday, July 28th, we got the first estimate of GDP for Q2, which was predicted to be between 2% (NY Fed) vs. 2.5% (Atlanta Fed) and turned out to be 2.6%. Remember, that number is a seasonally adjusted annualized rate extrapolated from the current quarter’s growth. It is a very rough prediction of the future reality.
Looking at year over year growth smooths out some of the noise. So let’s put our economist hats on and look at the actual government data filtered through two charts.
Real GDP below compares the current GDP number vs Real GDP in the same quarter one year ago, as a % increase (Shared on Twitter/StockTwits on Fri.):
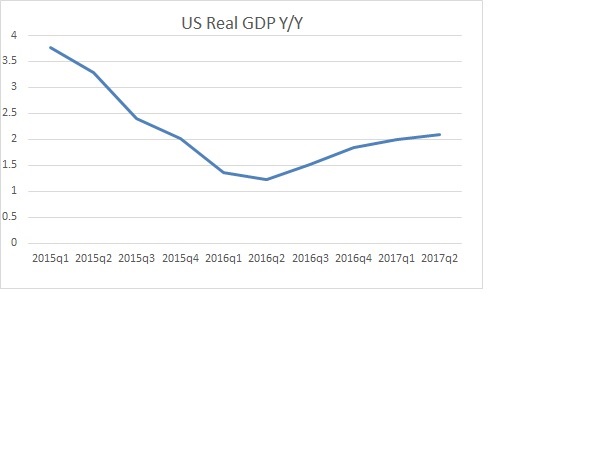
GDP Year over Year Growth in %
You can see above that Year over Year GDP has been rising over the last few quarters, but the next chart shows that the rate of increase is declining. (The equivalent in the above chart is that the curve has been flattening especially over the past 2 quarters.)
Here is the percent change in the Real GDP Y/Y number vs. the prior quarter, which demonstrates that the rate GDP Y/Y is rising is dropping (a second derivative for math people; for others, it’s enough to see that the rate of growth in GDP Y/Y is falling):

Real GDP Year over Year Growth as % Change vs. the prior quarter
Note that if you waited to buy the SP500 Index on an economic market timing basis until the above chart inflected upward with the Q2 2016 report in late July, you missed a good portion of the market rally. That report came out pretty close to the Aug. 2016 high. You caught more of the gains if you bought the reversal off the Feb. 2016 low instead.
As long as growth remains above 2%, the market will probably be OK, but gains may come slower given the slowing of the rate of acceleration of GDP Year over Year.
US Employment numbers will be out Friday August 4th. My sense is they need to be close to 200,000 (170-230K) to keep the market and the Federal Reserve happy.
Keep up-to-date during the week at Twitter and StockTwits (links below), where a combined 29,052 people are joining in…
Twitter® Follow Me on Twitter®. Follow Me on StockTwits®.
SP500 Large Cap Index (click chart to enlarge; SPX, SPY):

Holding gains nicely in consolidation after a breakout.
Survey Says! Sentiment of individual investors (AAII.com) showed a Bull minus Bear percentage spread of +10.14% vs. +9.67% last week.
Same comment applies as last week so I won’t repeat it (link to upper right). The neutral rate being high is Bullish as I’ve explained in the past.
| Thurs. 12 am close to poll | Bulls 34.46% | Neutrals 41.22% | Bears 24.32% |
2. U.S. Small Caps: I added back an option hedged IWM position (covered IWM calls) this past week when the market was down a bit on the 25th. This gives me a cushion of the 2.5ish points that the option credit yielded. It looks as though I may need the protection as IWM failed a breakout for the second time (two downward green arrows) as the market timing chart shows below… Note however, IWM remains above the trigger line, which is Bullish for stocks until that changes. A fall below the orange line would get my attention. Even falling below the late April IWM market timing high would be a negative and likely result in a back-test of the orange trigger line.
Russell 2000 U.S. Small Cap Index (click chart to enlarge; IWM, RUT):
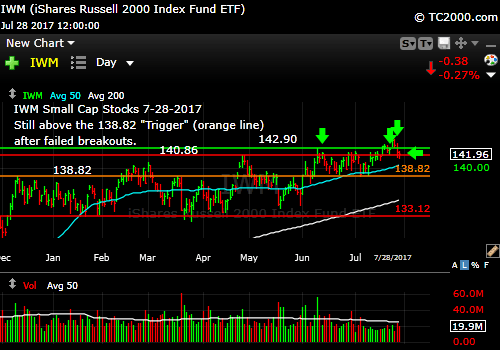
IWM with a second failed breakout.
3. Gold: Same story still vs. last week: Gold is moving generally in the opposite direction of rates. For more on this, see last week’s comments and Google search “When does gold shine” (3rd link down). A new high above the April and June highs would be another market timing trading BUY signal. Interest rates need to stay low (see last chart below) to allow this to happen. The first was the bounce off support earlier in July.
Gold ETF (click chart to enlarge the chart; GLD):
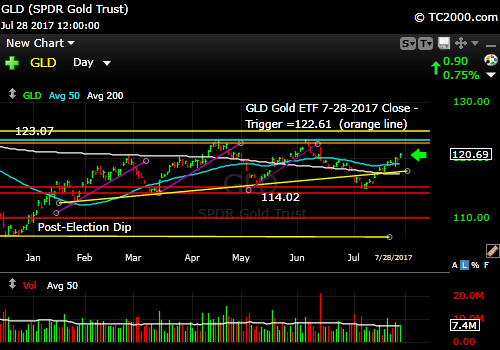
Gold could keep moving up to the orange line/prior highs.
4. U.S. 10 Year Treasury Note Yield (TNX): The Federal Reserve left rates alone as expected, and rates remained tame, which will continue to hurt financials that derive life from how much they can make on their loans (interest rate margin). I suspect 10 Year Yields could continue to meander around between the orange line and 2.489% or to the green line in the market timing chart below…
U.S. 10 Year Treasury Note Yield (click chart to enlarge; TNX, IEF, TYX,TLT,TBF):

Rates remain tame.
Let’s review the three market timing signals together….
MY SIGNAL SUMMARY for a Further U.S. Stock Market Rally is:
Stock Signal ON, Gold signal ON (good for stocks, not gold), Rate Signal ON (good for stocks, not bonds).
Thank you for reading. Would you please leave your comments below where it says “Leave a Reply”… or feel free to ask a question… Pay it forward too by sending the link to MarketTiming.Blog to a relative or friend. Thank you.
Note: My monthly newsletter is now CLOSED to new subscriptions until late this year. I’ll let you know here if and when it reopens.
Be sure to visit the website for more general investing knowledge at:
Standard Disclaimer: It’s your money and your decision as to how to invest it.
I thank Worden Brothers for the charting system I use to post these charts. If you want to know more about the charting system I use every day, go to my “Other Resources” page here: Other Resources It makes it much easier to follow along with me if you can see the charts and manipulate them on your own computer. It’s a great investment to have an excellent charting system. Check it out with a free trial at the link above.
Copyright © 2017 By Wall Street Sun and Storm Report, LLC All rights reserved.
