A Market Timing Report based on the 7-21-2017 Close, published Sunday, July 23rd, 2017
I deliver focused comments on market timing once or twice a week. These are supplemented with daily “Tweets/StockTwits” (see links below).
1. SP500 Index: Companies that had being doing well are holding up through earnings and some that were not doing as well, such as IBM, continue to be troubled. Thus far, 97 companies have reported Q2 earnings. This summary shows you where the greatest growth is in both earnings and revenue for the second quarter: HERE
On the 28th, we’ll get the first estimate of GDP for Q2, which could be between 2% (NY Fed) vs. 2.5% (Atlanta Fed), but don’t bank on those numbers, as they are unreliable historically. They may get lucky. A much stronger GDP number than expected will be taken as a positive reading on confidence in the Trump administration, which has been under pressure with the Russia investigation and delayed action on health care.
In market timing terms, the SP500 Index continues to make new highs against a backdrop of investor skepticism, which means there is room for a further rally. I will continue to stay with this rally until the economy turns, the market timing technicals turn, or both.
Keep up-to-date during the week at Twitter and StockTwits (links below), where a combined 28,868 people are joining in…
Twitter® Follow Me on Twitter®. Follow Me on StockTwits®.
SP500 Large Cap Index (click chart to enlarge; SPX, SPY):

New highs after consolidation.
Survey Says! Sentiment of individual investors (AAII.com) showed a Bull minus Bear percentage spread of +9.67% vs -1.39% last week.
Bullish sentiment does not generally peak out here and is likely to move to 20-30% before the Bull becomes tired again.
| Thurs. 12 am close to poll | Bulls 35.48% | Neutrals 38.71% | Bears 25.81% |
2. U.S. Small Caps: On the negative side, the small caps failed a breakout above a recent high, but on the positive side, they remain well above the orange market timing trigger line we were observing. My IWM sell on a small pullback turned out to be premature, though my exposure to equities is still quite high. There was not enough of a drop to make a re-entry IWM trade worthwhile. It could be that this failed breakout will just be a minor retest of the late April high. Remember I put my chips in the large caps and mid caps for the longer haul and use the small caps as a trading position.
Russell 2000 U.S. Small Cap Index (click chart to enlarge; IWM, RUT):
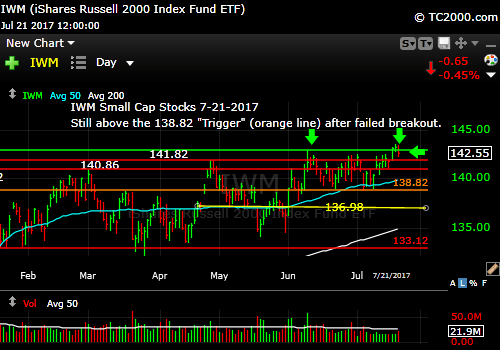
Small caps fail a breakout but above trigger line.
3. Gold: Gold is moving in the opposite direction of rates. Keep track of the market timing of rates if you want to know when to exit a trading position in gold. It’s possible that GLD will reach the April and June highs before this move ends, and the 10 Year Yield will move down to the June low. It is also possible the 10 Year will respect the orange trigger line and bounce (see below). Rates are the dog, and gold is the tail, regardless. I own gold for insurance only, because as the economy improves, rates will rise eventually and pressure gold, which has a yield of zero.
Gold ETF (click chart to enlarge the chart; GLD):

Gold in steady up trend with rates in steady downtrend.
4. U.S. 10 Year Treasury Note Yield (TNX): Rates are falling again. Inflation is still reasonably contained and GDP growth across the world is a bit sluggish. A stronger economy would lead to higher rates sooner. The move in rates may be about done here. You can see how rates have respected my market timing “trigger line” a few times already. It’s possible that rates will bob up and down in a fairly low trading range for the next 6 months to a year, perhaps longer. Testing the June low is possible as mentioned above. Remember this decline hurts the financials (XLF).
U.S. 10 Year Treasury Note Yield (click chart to enlarge; TNX, IEF, TYX,TLT,TBF):

Rates dropping when the market had been expecting gradually rising rates.
Let’s review the three market timing signals together….
MY SIGNAL SUMMARY for a Further U.S. Stock Market Rally is:
Stock Signal ON, Gold signal ON (good for stocks, not gold), Rate Signal ON (good for stocks, not bonds).
Thank you for reading. Would you please leave your comments below where it says “Leave a Reply”… or feel free to ask a question… Pay it forward too by sending the link to MarketTiming.Blog to a relative or friend. Thank you.
Note: My monthly newsletter is now CLOSED to new subscriptions until late this year. I’ll let you know here if and when it reopens.
Be sure to visit the website for more general investing knowledge at:
Standard Disclaimer: It’s your money and your decision as to how to invest it.
I thank Worden Brothers for the charting system I use to post these charts. If you want to know more about the charting system I use every day, go to my “Other Resources” page here: Other Resources It makes it much easier to follow along with me if you can see the charts and manipulate them on your own computer. It’s a great investment to have an excellent charting system. Check it out with a free trial at the link above.
Copyright © 2017 By Wall Street Sun and Storm Report, LLC All rights reserved.
