A Market Timing Report based on the 2-02-2018 Close, published Sunday, February 4th, 2018…
I deliver focused comments on market timing once or twice a week. These are supplemented with daily “Tweets/StockTwits” (see links below).
If you are not interested in how to properly track the recovery of the market in accounting terms, skip this section and go to the SP500 Index market timing discussion below it. Thanks!
UPDATE Thursday, 2-08-2018: A Strategy to Redeploy Cash and Account for Your Net Selling/Buying vs. Losses
I just ran through this process tonight and it will help you manage the recovery in the market and realize where you stand now Specifically, you will know what money you have put into/taken out of the market as a net value and could then add back. It will also tell you the gain you have to have to recoup your losses from the top. If you’ve been invested long into the recent decline as I have, you have some losses for sure. But some of you took some off the table on the way down or even near the top and have since added some back as I did. That’s a mix of buying and selling. I would suggest constructing an Excel spreadsheet in which you list your market timing buys and sells since the 1-26-2018 close (with sells as minuses and buys as pluses) and determine:
1. How much you have bought or sold NET vs. the closing value of your investable assets in stocks on 1-26-2018 – the top for the SP500 Index. Say your net reduction of stock assets was $40000 to keep it simple. That’s not a loss. That is the amount of stock you simply let go of. The number at the top of the spreadsheet should be the total value of all your stock assets at the 1-26-2018 close. Then you list your buys/sells below as +’s and -‘s, respectively and have a total at the bottom. That total will NOT take into account the gains/losses you have from the fall in the prices of the stocks in the list of buys/sells since 1-26.
2. Then determine what the actual complete reduction has been in your total stock allocation from 1-26-2018 to today, which would include losses as well as the net selling/buying you did in #1 above. Say that total reduction with both selling and losses in asset value was $60000.
3. That allows you to know your total ACTUAL loss (excluding the reduction in stocks due to selling) and means your net loss was only $20000 and you can then determine the loss in investable net worth from the top. That’s all you need to make back on the way back to the 1-26-2018 valuation of your assets.
4. The key is to realize how much the market is likely going to add back to your net worth on the way back up and how much more exposure you could add to help get it there, but without (just as an ex.) increasing your total exposure to stocks vs. 1-26. That $40,000 number (in the example above) is your target for “buying lower.” You can add $40,000 in stock buys prior to the market’s recovery to try to capture some gains from what you have sold, and hopefully you add that closer to the eventual low. You may pick several entry points about “here,” lower and higher as the sell-off then recovery progresses. Yes, there is always a recovery. The trick is “from which level”? I’ll be discussing that in this weekend’s post…
5. If you feel the prospects for the economy are declining now (I don’t, but you may), then you may not want to add anything back and simply allow your current holdings to appreciate back to their prior value if things go well for the U.S. markets and give up some of the gains by holding more cash. Or you may decide to use market timing to be more heavily invested on the way up than you were on the way down, even if you sold nothing near the top. You can do that by deploying more cash if that makes sense and feels safe to you. Use stops on new positions to protect newly deployed capital, but only if you intend to re-enter lower or higher if you are proven wrong! Being out of the market has a cost too.
Now back to last Sunday’s issue…
1. SP500 Index Market Timing: I preface my remarks by saying I do not use political information on this blog to make political points. I use it to analyze the likely impact on markets – period. I am in fact an independent in practice. I vote for people who make sense and who are fiscally conservative. Now back to the wood…
The release of the “Nunes Memo” was a partisan stunt, because it contained incomplete information. That said, there are issues it raises that could be looked at objectively. The crux of the memo in investment terms is this:
- If the #Memo leads to the firing of Rod Rosenstein, the Assistant District Attorney, which then leads to a stooge replacing him, who then replaces or fires Robert Mueller (a Republican) as Special Prosecutor on the Russia investigation, the SP500 Index will likely go into a deep dive resembling the impeachment of Clinton in magnitude, which I’ve already detailed in a chart HERE. Go to that link to read the “drum-roll number.” We’ll have that much of a drop very likely plus or minus 5% if the firing scenario occurs.
- If the Memo is used simply as pushback against the investigation and the key two players in the Russia investigation stay in place, the market will recover, unless more members of the Trump campaign and/or administration are implicated.
- There will be no Clinton-sized drop in the markets without a perceived direct legal threat to Trump.
Fortunately, on Friday night the Assistant Press Secretary told CNN’s John Berman there was no current discussion of firing either Rosenstein or Mueller. However, the veiled threat to fire Rosenstein made by Trump to reporters on Friday could make things unstable until he himself recants the threat. Until this tactic is further clarified by Trump himself, the market could go down another 2-4% from here, but I believe it will then rebound. It may simply rebound off the Friday low without a further statement by Trump himself. The clearer Trump is that he will NOT interfere, the better for the markets, which hate uncertainty, and the earlier they will rebound.
Rising interest rates were also a factor on Friday, but rising rates don’t kill Bull markets. Employment was stronger than expected, which is also fine during a recovery as long as wages don’t rise too fast.
The Y/Y rise in U.S. wages at a rate of 2.9% when less was expected was a concern for the markets, though some said the number was in part due to an accounting anomaly. We are not yet at the point of “out of control inflation” by any means, but we’ll keep an eye on it and on the Fed who has a new chair now by the name of Jerome Powell, and a potential tilt of the Fed given the new members toward higher rates and a more restrictive monetary policy. This is only a concern if raising rates is overdone vs. what is needed to contain inflation.
I admit, overly aggressive Fed policy could reduce returns in the stock market over the next 5 years, which would mean lower returns and higher volatility.
Keep up-to-date during the week at Twitter and StockTwits (links below), where a combined 33,300+ people are joining in…
Follow Me on Twitter®. Follow Me on StockTwits®.
Note in the chart below, how the market is giving up some of the “excess gains” we accrued based on Tax Bill passage news. Where will the drop stop? The drop to date from the intraday high is 3.87%. I discuss targets in the sentiment section below.
SP500 Large Cap Index (click chart to enlarge; SPX, SPY):
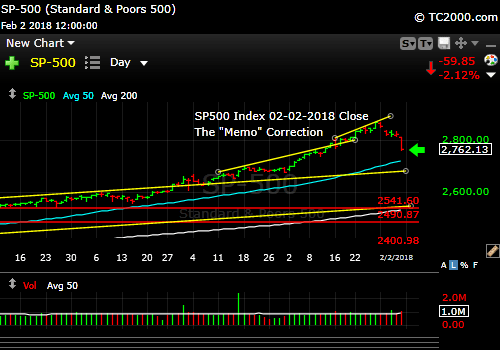
The “Memo” Correction should end soon unless the key players are fired.
Survey Says! Sentiment of individual investors (AAII.com) showed a Bull minus Bear percentage spread of +16.01% vs +21.42% last week. The “Memo Threat” did not arise until the end of the week, and the market has taken a small dive of about 4%, so expect the spread to become more Bearish this week, unless there is a quick bounce in the markets. I believe that this is in fact the 6-8% correction I was expecting after the sentiment peak I went over in early January HERE. The SP500 Index will correct over 20% in my view, if the political situation goes downhill fast.
I also went over the timing of the correction last week HERE. The correction arrived just one week after the shortest interval mentioned last week – about 3 weeks. The correction actually began just one day shy of 4 weeks from the sentiment peak. We are down 3.87% off the intraday high. Without an immediate bounce, we could dip to an S&P500 value of 2715 (-5.5%), the 50 day moving average, which is a very rough target, OR to the top line of the prior channel or 2677 (-6.8%). I would expect a bounce at or before either of those two targets are reached, unless the political situation worsens as discussed.
| AAII.Com Individual Investor Sentiment Poll | ||
| Bulls | Neutrals | Bears |
| 44.77% | 26.47% | 24.03% |
| Thurs. 12 am CT close to poll | ||
2. U.S. Small Caps Market Timing: The small caps have pulled back about 4.2% from the intraday high. This probably would have been worse without higher rates, which benefit the financial component of the small cap index (25% as of 12-31-2018 per Vanguard as noted HERE. The drop to the next breakout point would be a 6.20% correction. The yellow line shown could interrupt the fall as well. These are just guidelines and possible entry points. I look at the data behind the price at the time I buy ETFs or stocks. It is possible the fall we’ve had could be enough unless, as said, the political climate worsens.
Russell 2000 U.S. Small Cap Index (click chart to enlarge; IWM, RUT): Longer term view…

Another drop in store?
3. Gold Market Timing: Gold is falling now on dollar stabilization. Europe cannot take much more in the way of Euro strength as their economy is showing signs of cracking. Rates have moved up in a big way and are headed to 3% perhaps on this move, which will hurt gold. Preserve profits on trades at a level that suits you. You can see the failed attempt to break out above the Sept. high (green line).
Gold ETF (click chart to enlarge the chart; GLD):

, Gold down on stabilizing dollar and rising rates.
4. Interest Rate Market Timing – U.S. 10 Year Treasury Note Yield (TNX): TrumpFlation is intact as a theme of this recovery process, and rates are headed to 3%, perhaps during this move. If stocks sell off more, rates could stabilize and inflect downward, because money will move into Treasuries as a risk off position. Notice the exponential move starting? This means exhaustion is ahead and will happen soon, between here and 3% perhaps, meaning rates may moderate vs. current levels for a bit.
U.S. 10 Year Treasury Note Yield (click chart to enlarge; TNX, IEF, TYX,TLT,TBF):

Rates rising.
We need to review our three market timing signals (below the Bitcoin comments)…
5. Bitcoin Market Timing: See my update HERE (which will be posted separately from now on…).
Now let’s review the three market timing signals together….
MY SIGNAL SUMMARY for a Further U.S. Stock Market Rally with Low Inflation:
Stock Signal YELLOW with SP500 Index in Bullish Trend
Do not use these signals as a trading plan. They are rough guidelines.
Note: I’ve updated my criteria for the equity signal for a further U.S. stock market rally to the following: GREEN = Bullish, YELLOW = Neutral, RED = Bearish.
Explanation: Note that a RED signal does not mean we should not buy. A GREEN signal does you cannot sell some exposure. It depends on what is going on in the economy and how oversold/overbought the market is at a given point whether the Bearish signal is to be sold, sold on the next bounce, etc. and whether a Bullish signal is to be bought or profits should be taken. YELLOW does not mean the end of the Bull or Bear. It means look for possible entry points within the existing trend, Bull or Bear, but preserve capital if the entry fails. Our strong intention is to buy low and sell high. By the way, I will keep showing the prior orange “Trigger lines” in the charts for now as reference points only; they have historical value for us from the post-election period.
Gold Signal YELLOW with Gold in Bullish Trend.
GLD is coming off a failed breakout which makes it “Yellow” but ABOVE the “Trigger line” which is positive for gold, and usually worse for stocks at least on a relative basis, IF inflation is getting out of hand. Then it’s gold up (based on negative real rates of return on debt), stocks down (again, eventually that is, if inflation becomes too “hot”).
Rate Signal GREEN with 10 Year Yield in Bullish Trend
10 Year Yield ABOVE the “Trigger Line,” good for stocks, not bonds. Yet the trend is becoming too steep and a pullback in rates will likely start soon.
Thank you for reading. Would you please leave your comments below where it says “Leave a Reply”… or ask a question… Pay it forward too by sending the link to MarketTiming.Blog (that link will immediately connect them to this webpage) to a relative or friend. Thanks for doing that.
Be sure to visit the website for more general investing knowledge at:
Standard Disclaimer: It’s your money and your decision as to how to invest it.
I thank Worden Brothers for the charting system I use to post these charts. If you want to know more about the charting system I use every day, go to my “Other Resources” page here: Other Resources It makes it much easier to follow along with me if you can see the charts and manipulate them on your own computer. It’s a great investment to have an excellent charting system. Check it out with a free trial at the link above.
Copyright © 2018 By Wall Street Sun and Storm Report, LLC All rights reserved.
