A Market Timing Report based on the 3-23-2018 Close, published Sunday, March 25th, 2018…
I deliver focused comments on market timing once or twice a week. These are supplemented with daily “Tweets/StockTwits” (see links below).
1. SP500 Index Market Timing: The title of the post indicates that the market was “coming after” the leaders of the big 2017 to early 2018 rally on Friday, stocks such as Amazon (AMZN) and Nvidia (NVDA). Weaker stocks generally fall first and then the generals are taken down on a relative valuation basis.
Besides that, some negative things happened technically in the SP500 Index this week.
1. The double top held its ground (no breakout), and the market slid below the 50 day moving average. Remember, we don’t trade off that moving average, but rather, we just note it and then examine the behavior of the market when it is reached, so in some senses it does not matter a lot. But one thing it does tell me is how long the market will require to heal when it violates it to the downside.
2. The upward Bearish Wedge was broken to the downside.
3. The Upper line forming the long term up channel was again violated to the downside.
4. The March 2nd low was easily breached.
5. The 200 day moving average is being retested now along with the longer term channel bottom (lower yellow line).
It is possible Friday marked the near term low in the market – possible. In fact, if Trump et. al. came out early Monday and said “The Chinese are willing to negotiate a new trade agreement to avoid a mutually destructive trade war,” the markets would bounce hard. This means shorting the current level of the market is risky if you are not being stock-selective about it.
A Bear could easily say the obvious target for the market is a complete or penetrating retest of the Feb. 6th low of 2532.69, which is just 2.15% from Friday’s close. Often markets fall to these obvious levels before bouncing, so my working assumption is that this is the next target for a bounce (with an overshoot of some magnitude).
Let’s look at the chart and then look at lower targets…
SP500 Large Cap Index (click chart to enlarge; SPX, SPY):
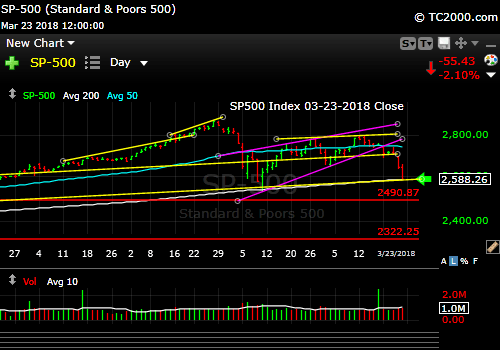
Testing near the prior major low…
If that level holds, this will have been a C wave of an A – B – C wave formation. If not, the next target could be the Fibonacci target mentioned last week HERE. Write down that number – again, all market levels including Fibonacci levels are just guides and only trigger trades if the market set-up is right at the time. Remember that after a relatively rapid decline of the past two days there is often follow-through based on margin calls and reactive discussions of “Should we get out honey?” across the households of America. I expect to see Jim Cramer on the Today Show again soon. He’s 0ften there calming people down when volatility spikes.
Is this the beginning of a Secular (long term with losses greater than 25% generally) Bear Market?
First, let me coin some new terms here if you would… Let’s call a shorter, shallower Bear Market within a Bull Market a “Mini Bear Market” and let’s call a really big decline of well over 25% associated with recession, which is a Secular Bear Market a “Big Bear Market.” And we’ll call Secular Bull Markets “Big Bull Markets” and cyclical Bull markets within long term Big Bear Markets “Mini Bull Markets.”
It’s unlikely this is a “Big Bear Market” in the making, as profits should continue to grow this year, albeit at a slower rate. The inflationary Trump tax policies (spending and tax cuts based on massive government debt) will help extend the Bull market further than it would have lasted otherwise. Short term, there could still be some slowing, but the tax policies could make the dip in GDP growth and profit deceleration less severe at the cost of future inflation and higher borrowing costs, in my view.
The slowing profit growth alone could compress PE’s, but is not enough in my view to end the secular Bull market. We could see further damage however than the approximately 10.3% drop from the January 26th closing high.
If we see a series of closing lows below the February low, meaning not just a quick intraday test below for example, we will then in my view be in a Mini Bear Market, and we’ll likely head to a significantly lower test, perhaps to the Fibonacci level mentioned. You can find a number of other levels of support in prior price action, but they have little meaning in my view. Around 2100 would be a loss of the entire post-Brexit gains (Brexit was bad for the U.K. and a blip for the U.S.). That would be my next target below my Fibonacci target (see link above; it’s in last week’s post).
Another important question is “How do you know a ‘Big Bear Market’ has begun?” The only way to truly front run a “Big Bear Market” is to predict the path of the economy. Bear markets are strongly associated with recession, so looking out for GDP growth to slow is paramount in detecting the biggest market turns.
The slowing in China, Europe, and India into 2018 could spread to the U.S., but the U.S. will probably be hit later than those markets on an economic basis. The Federal Reserve itself sees faster growth this year than they previously expected, but then sees a gradual decline of GDP over several years as noted HERE. However, they are not predicting a recession, out to 2020 at least. Profit recessions can cause cyclical “Mini Bear” Markets with drops of up to 25% or so, but Secular “Big Bear” Markets occur in recessions and result in drops of well over 25% (even 50% or much worse – for ex. the tech crash beginning of March 2000 in which the NASDAQ Index lost 78% of its value vs. the top).
The Fed GDP median prediction is shown below (link above to data). The Fed sees inflation rising to 2.1% by 2020 and being at their target of 2% longer term. Unemployment they say (as the median of the group) will fall from 3.8% this year to 3.6% for the following two years and then rise to the longer term rate of 4.5%. That low rate could start to push up inflation over the next couple of years.
| 2018
2.7 |
2019
2.4 |
2020
2.0 |
Longer Term
1.8 |
The above data says to me that PE ratios could compress in a Secular Bear Market, but there is no Secular Bear in the picture out a few years at least.
THE PLAN? Until GDP slowing rears its ugly head in a bigger way, we will need to find places to BUY LOW, SELL HIGH. The risk? Some say U.S. GDP will be declining in the third quarter of 2018, but that data does not include the influence of the Trump GOP tax cuts. That quarter starts July 1st. If companies start downgrading projections earlier than that, the market may front run the weakness. If we “buy low,” we may be needing to “sell high” faster than we think. No one can tell you what the impact of the tax cuts will be until they see what people actually do with the money.
What about technical analysis of markets? Does it provide a way to predict a Big Bear market? Other than saying the market is sustaining more damage than it had previously, not really, but it does tell you when you should consider lowering exposure, particularly if you need cash for your kids’ college education or other proximate expenses.
In my view, you should have already lowered your exposure a bit, even if the Bull market is not over. Why? Because markets around the world are breaking down in unison now. They were rising together just weeks ago. I am betting the SP500 Index will test the Feb. low and if it survives there and other technicals look OK, I will likely add back some exposure. If not, I will very likely lower my exposure even further, again, depending on the market set-up at the time. That is why you may want to stay plugged into the social media connections shown below… Things move fast when markets fall. They often fall faster than they rise due to the rush to the exits. Remember however, that it’s OK to add exposure and then quickly exit if a given low does not hold.
At this point, I would not personally lower my exposure except to protect profits here and there. Waiting for the next break makes more sense, but I understand that if you need the money sooner rather than later, you may want to sell some right away. I am just telling you what I’m doing real time on social media. I won’t be selling Monday intraday unless we end up falling below the Feb. low and that would be a very tricky trade intraday, because it could represent a capitulation followed by an immediate bounce. Remember to make your own decisions. Sometimes I’ve been early with buys by a day or more, which can be costly over the short term. In 2015, I bought the drop on August 20th and was two days early. The Flash Crash of 2015 happened on August 24th two days after that buy. Eventually I was up big on the buy of course, but in the short term, there is an opportunity for losses when you move too soon!
I will consider the SPX to be in a Bearish Trend only if the Feb. low is violated on a close. There is a Bearish set-up for the long 3rd wave down mentioned, but that obviously requires a breach of the Feb. low.
Look through your portfolio and sell the weak stuff, particularly on the bounces and rotate into stronger markets. For example, as Germany was breaking down, I sold exposure there and moved it to U.S. stocks and ETFs. I did the same for Japan and “old China.”
See how much I’ve lowered my exposure at the social media links just below…
Keep up-to-date during the week at Twitter and StockTwits (links below), where a combined 33,400+ people are joining in…
Follow Me on Twitter®. Follow Me on StockTwits®.
Survey Says! Sentiment of individual investors (AAII.com) showed a Bull minus Bear percentage spread of +4.74% vs. +15.51 last week. We still have not reached a sufficiently Bearish reading, even a moderately Bearish one, to say this sell-off is at or nearing the end.
| AAII.Com Individual Investor Sentiment Poll | ||
| Bulls | Neutrals | Bears |
| 33.23% | 38.28% | 28.49% |
| Thurs. 12 am CT close to poll | ||
2. U.S. Small Caps Market Timing: Notice that small caps are not falling as fast as large caps toward their 200 day moving average. Again, we are using that moving average as a marker, not a trading signal, unless everything else fits when we arrive there. Small caps are more insulated from the Trump Trade War, being conducted primarily against China, while protecting allies. This is a fact, and the market is reacting to this fact.
I would not call the Small Cap trend Bearish quite yet as there is a higher low (on Mar. 2) despite the double top.
Russell 2000 U.S. Small Cap Index (click chart to enlarge; IWM, RUT):

Off a failed breakout. Not falling as fast as SP500 Index.
3. Gold Market Timing: Rates did not blast off after the Fed meeting, so gold rose as expected. The dollar was only slightly lower though, and since CPI Y/Y is expected to rise into Q3 and Q4 per Bloomberg estimates, rates could rise again after falling a bit during this global stock market sell-off. For the time being, I think rates will stay below 3% in the U.S. If rates don’t fall substantially however, gold may remain range-bound (131.15 being the top), so protect any trading profits.
Gold ETF (click chart to enlarge the chart; GLD):

Gold rises on tame rates and slightly weak dollar.
4. Interest Rate Market Timing – U.S. 10 Year Treasury Note Yield (TNX): Rates did stay put as I predicted they would. Rates higher than the last high would hurt stocks. They would (AT THIS TIME), lead to deflation. Global Economic cooling should keep rates range bound for a while at least until U.S. inflation turns over from a peak in the 3rd quarter (per Bloomberg data). My lowest target is that green line in the chart and my first target is the “Deflationary Rate” I defined HERE (in the top SP500 section).
The Federal Reserve is raising rates into a slowing world economy with rates falling in the rest of the world except for China as the major example, where things will be worse as they are raising rates with ours, while their economy slows. This is bad for growth, especially in the “Old China” economy. That slowing could start to hit the new economy in China later, so we’ll be watching stops! And then the Federal Reserve will be forced to drop rates again as our economy slows.
U.S. 10 Year Treasury Note Yield (click chart to enlarge; TNX, IEF, TYX,TLT,TBF):

Coming down…but likely stuck in a range for a couple of quarters.
Now let’s review the three market timing signals together….
Do not use these signals as a trading plan. They are rough guidelines. I currently share my own moves on social media (links above).
MY SIGNAL SUMMARY for a Further U.S. Stock Market Rally with GDP Growth and Low Inflation:
Stock Signal YELLOW with a Neutral SP500 Index trend.
Much more detail in the text above.
Note: I’ve updated my criteria for the equity signal for a further U.S. stock market rally to the following: GREEN = Bullish, YELLOW = Neutral, RED = Bearish.
Explanation: Note that a RED signal does not mean we should not buy. A GREEN signal does you cannot sell some exposure. It depends on what is going on in the economy and how oversold/overbought the market is at a given point whether the Bearish signal is to be sold, sold on the next bounce, etc. and whether a Bullish signal is to be bought or profits should be taken. YELLOW does not mean the end of the Bull or Bear. It means look for possible entry points within the existing trend, Bull or Bear, but preserve capital if the entry fails. Our strong intention is to buy low and sell high. By the way, I will keep showing the prior orange “Trigger lines” in the charts for now as reference points only; they have historical value for us from the post-election period.
Gold Signal YELLOW with a Bullish Gold Trend
No changes from last week. To Repeat: Remember GLD is being used as an indicator for the ECONOMY here. A new recent LOW in GLD will turn the signal GREEN. It’s a bit more complicated over the short term as rates above 3% are currently being taken as a negative by the markets. Gradually rising rates can be fine for the economy, but not rates that rise too fast as important parts of the world economy slow.
Rate Signal YELLOW with a Neutral 10 Year Yield Trend.
To Repeat from last week: “Remember this too is a signal for a “further stock market rally” as it’s being used here. Remember “Bullish” for yields is Bearish for bonds and vice versa.
For the near term move, the bond setup is Bullish due to the wedge break. Longer term, I expect rates to gradually rise as the recovery matures and the fiscal stimulus either wears off or forces the Fed to raise rates repeatedly due to inflation finally increasing.”
As said two weeks ago: “Remember that Goldilocks feelings (growth with relatively low rates) will vaporize if and when we return to a worldwide slowdown with deflationary fears. Then rates would plunge, causing bonds to make big gains, gold to rally strongly, and stock markets to decline in a big way. Remember that any rapid reset could hurt gold as well as liquidity is sought. “
Thank you for reading. Would you please leave your comments below where it says “Leave a Reply”… or ask a question… Pay it forward too by sending the link to MarketTiming.Blog (that link will immediately connect them to this webpage) to a relative or friend. Thanks for doing that.
Be sure to visit the website for more general investing knowledge at:
Standard Disclaimer: It’s your money and your decision as to how to invest it.
I thank Worden Brothers for the charting system I use to post these charts. If you want to know more about the charting system I use every day, go to my “Other Resources” page here: Other Resources It makes it much easier to follow along with me if you can see the charts and manipulate them on your own computer. It’s a great investment to have an excellent charting system. Check it out with a free trial at the link above.
Copyright © 2018 By Wall Street Sun and Storm Report, LLC All rights reserved.
