A Market Timing Report based on the 5-18-2018 Close, published Saturday, May 20th, 2018…
I deliver focused comments on market timing once or twice a week. These are supplemented with daily “Tweets/StockTwits” (see links below).
1. SP500 Index Market Timing (S&P 500 Index®; SPY, SPX): What did the Intel-igent Signal say this week? INTC closed at 53.50 for the week with the breakout at 54.36. The signal is NEGATIVE for a continued large cap rally in other words, but can reverse back up from here, so keep following it with me.
I warned you last week about the Bank of America signal and when rates eased a bit on Friday, BAC rolled over below the 50 day moving average. Remember that average is not a great trading signal, just a landmark that gives you a quick idea of how strong a stock is. Generally stocks are weak if they are rolling over and falling below that moving average line, especially if the line is falling rather than flat or rising.
What about that “Big Picture” this week? The Big Picture is that of a second set of LOWER double tops, lower than the last double top back in the end of Feb. into March. But the large caps are still in the upper part of the 2017 channel, which says they are still on trend in that sense, despite the big loss off the over-exuberant top we saw back in January. (Read last week’s issue to catch up on that: HERE.)
Furthermore, with the small cap breakout out to new highs, there is hope for large caps. Small caps had a very strong earnings season, and as they carry greater risk (“high beta”), we would expect them to lead the way down if the market were about to fall apart. They are not. They are leading instead.
Interest rates did hit fresh highs this past week as I’ll cover below in more detail, but then eased. I believe that if the 10 Year Treasury Rate continue to climb next week toward 3.25%, stocks will be pressured. You need to read the last few issues to really hear this, but it’s not the rate LEVEL that is important; it is the rate of change of rates that is key. A fast climb in rates will cause another episode of “Rate Shock” as I discussed here back on February 11th.
Volatility is burning off as I’ve been telling you for weeks now. The VIX Volatility Index close was at 13.42 on Friday. I would have preferred a close below 13.31 with a stronger close above the 4-18 high of 271.30. The SPY close was 271.33. The SP500 Index itself closed at 2712.97 vs. a 4-18 high of 2717.49. Not good enough, although only 0.17% below that high. That is a lower high and a failed breakout, despite the SPY close. Long time readers and social media followers know that these numbers are discerned by carefully watching the behavior of the market. These closes are what I call “cute.” A little above on the VIX, a negative, and a little above for the SPY, a positive, but with the SP500 Index below its 4-18 high, this is not a pattern that says the market’s decision has been made.
I recently adjusted my exposure down a bit by taking off some profits in Google and Netflix as examples. My exact exposure is something I publish fairly soon after each trade in or out of the market on social media (be sure to follow me on Twitter as well as StockTwits as sometimes there are access issues, and I cannot post to one or the other – links are below).
Keep up-to-date during the week at Twitter and StockTwits (links below), where a combined 33,480 people are joining in…
Follow Me on Twitter®. Follow Me on StockTwits®.
SP500 Large Cap Index (click chart to enlarge; SPX, SPY):
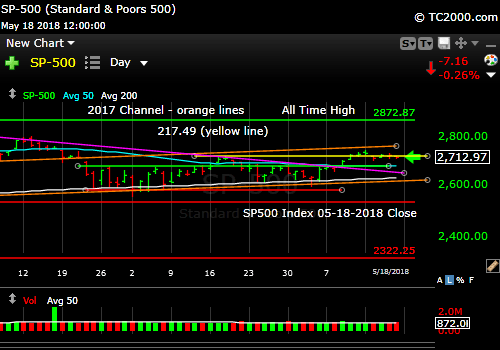
Large caps are trailing small caps.
Survey Says! Sentiment of individual investors (AAII.com) showed a Bull minus Bear percentage spread of +16.10% vs. +7.98% the prior week. This is still not too Bullish to prevent more upside from here, and the percent of Neutrals is Bullish for prices 6 months from now as loyal readers know well. The latter fact was proven by AAII research on the sentiment patterns that matter. The Bears are getting low in number, which is one cautionary sign, but there are plenty of neutrals to convert.
| AAII.Com Individual Investor Sentiment Poll | ||
| Bulls | Neutrals | Bears |
| 36.68% | 42.74% | 20.58% |
| Thurs. 12 am CT close to poll | ||
2. U.S. Small Caps Market Timing (IWM): Small caps have broken out to a new all time high. Still, midcaps, which I favor over the long term are leading small caps vs. the 2009 low. Small caps took a bigger hit in the 2015 and 2016 downdrafts and fell behind. This also does not take the larger dividend of the midcaps into account. The returns including dividends of the three major indexes each starting with $10,000 on 3-06-2009 are:
| SPY | IJH | IWM |
| 375.82% | 433.66% | 417.88% |
| $47,582.00 | $53,366.00 | $51,778.00 |
The winner since 2009 is IJH, the midcap ETF, but since Feb. 27th, the small caps have been outperforming the midcaps by a significant margin, while both have left SPY in the dust. The data is from this handy calculator you may want to check out HERE.
| SPY | IJH | IWM |
| -0.73% | 3.37% | 6.21% |
Russell 2000 U.S. Small Cap Index (click chart to enlarge; IWM, RUT):
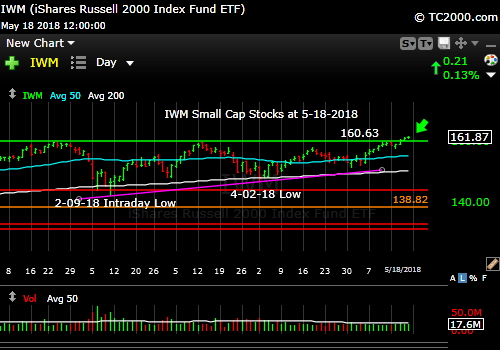
Small caps are strong. New Breakout.
3. Gold Market Timing (GLD): The U.S dollar kept moving up and pushed GLD below important support and even below the line I drew in the sand after Trump was elected, saying that gold should go below there if the economy is strong. There is something different though now with rates where they are and that is that real interest rates are higher. Gold hates rising real rates as much as it hates a rising U.S. dollar. We have both. You should have exited trading gold positions by now. If you haven’t, I would sell on the first new high in TNX (see chart below) or in the first new high in the US dollar .
The Gold ETF (click chart to enlarge the chart; GLD):
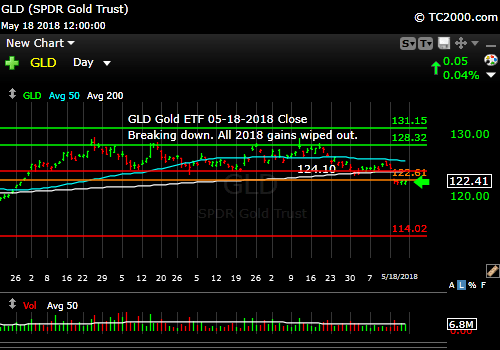
Breaking down on strong dollar and higher real rates.
4. Interest Rate Market Timing – U.S. 10 Year Treasury Note Yield (TNX): Rates are too high for current economic conditions. As I said HERE last week, the Federal Reserve is likely to be the cause of the next economic contraction as it seeks to put a brake on inflation, which is its sole mandate now that unemployment is low in their view. The Treasury/Bond Bulls need to see a reversal below that top green line for starters.
Any encouraging signs? Yes. The 30 Year Yield just gave up a new breakout this past week, closing at 3.210% below the prior tops at 3.221% and 3.219%.
If the opposite happens, and rates rise to a new high this week, I predict the U.S. stock markets will choke, and emerging markets will gasp.
First review the rate chart below and THEN I’ll go over signal updates…
U.S. 10 Year Treasury Note Yield (click chart to enlarge; TNX, IEF, TYX,TLT,TBF):
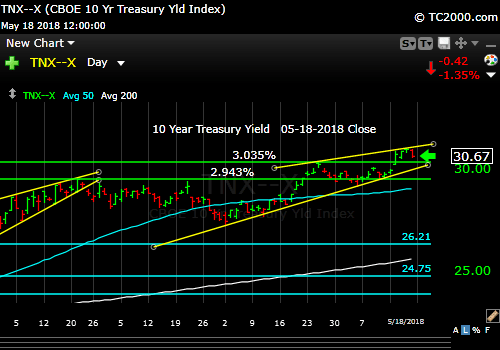
Rate trend is still up. A reversal of any breakout is important to watch for though.
Now let’s review three key market timing signals together….
Do not use these signals as a trading plan. They are rough guidelines. I currently share my own moves on social media (links above).
MY SIGNAL AND TREND SUMMARY for a Further U.S. Stock Market Rally with GDP Growth and Low Inflation:
Stock Signal Neutral with a Bullish SP500 Index trend. The higher high above the 4-18 high was lost for the SPX, but not for SPY; however, the price is still in the upper part of the 2017 upward channel, so the trend is still up. VIX must move below 13.31 on Monday, and SPX must retake the 4-18 high.
Remember the small caps are GREEN already, but I cannot give the entire market a GREEN light when the large caps have not confirmed the small cap signal. Buy pullbacks in small caps but do not buy a reversal below the highs shown. Use stops on new purchases on a close below those highs – meaning get out if the small caps fail.
Gold Signal GREEN with a Bearish Gold Trend. Gold broke down to new lows and the trend is down. See test above.
Remember GLD is being used as an indicator for the ECONOMY here. The new recent LOW in GLD turned the signal GREEN.
Rate Signal GREEN with a Bullish 10 Year Yield Trend. A new high cannot be refuted. Bears need a reversal.
Remember this GREEN signal is a signal for a “further stock market rally” as it’s being used here. Remember also “Bullish” for yields is Bearish for bonds and vice versa. There is a twist here though. This level of the 10 Year Treasury Yield, which is too high for current conditions as explained HERE, will eventually slow the economy.
Note: I’ve updated my criteria for the equity signal for a further U.S. stock market rally to the following: GREEN = Bullish, YELLOW = Neutral, RED = Bearish. In other words, the colors tell you whether the signal supports the stock rally or not, while the Bullish, Neutral, and Bearish designations are about the trend.
Explanation: Note that a BEARISH signal does not mean we should not buy. A BULLISH signal does not mean you cannot sell some exposure. It depends on what is going on in the economy and how oversold/overbought the market is at a given point whether the Bearish signal is to be sold, sold on the next bounce, etc. and whether a Bullish signal is to be bought or if profits should be taken. A NEUTRAL signal does not mean the end of the Bull or Bear. It means to wait and look for possible subsequent entry points within the existing trend, Bull or Bear, but preserve capital if the entry fails. Our strong intention is to buy low and sell high. By the way, I will keep showing the prior orange “Trigger lines” in the charts for now as reference points only; they have historical value for us from the post-2016 election period.
Thank you for reading. Would you please leave your comments below where it says “Leave a Reply”… or ask a question… Pay it forward too by sending the link to MarketTiming.Blog (that link will immediately connect them to this webpage) to a relative or friend. Thanks for doing that.
Be sure to visit the website for more general investing knowledge at:
Standard Disclaimer: It’s your money and your decision as to how to invest it.
I thank Worden Brothers for the charting system I use to post these charts. If you want to know more about the charting system I use every day, go to my “Other Resources” page here: Other Resources It makes it much easier to follow along with me if you can see the charts and manipulate them on your own computer. It’s a great investment to have an excellent charting system. Check it out with a free trial at the link above.
Finally: Excuse and report all typos if you are so moved. I do my best to pick up most of them, but can’t find them all. Shoot me a comment (I don’t have to post your typo report as I filter them, but I’ll be grateful to you!)
Copyright © 2018 By Wall Street Sun and Storm Report, LLC All rights reserved.
