A Market Timing Report based on the 5-25-2018 Close, published Sunday, May 28th, 2018…
I deliver focused comments on market timing once or twice a week. These are supplemented with daily “Tweets/StockTwits” (see links below).
1. SP500 Index Market Timing (S&P 500 Index®; SPY, SPX): What did the Intel-igent Signal say this week? INTC closed at 55.44 for the week with the breakout at 54.36. The signal is now again positive for a continued large cap rally, but it has already reversed once before.
I warned you last week about the Bank of America signal, and the stock is even weaker than it was last week, which is correlated with rates moving back down. The chart set-up is more Bearish than Bullish with lower highs off a base.
The SP500 Index is still above that key 4-18 top at 2717.49. The VIX volatility index closed Friday at 13.22, below the Bull 13.31 target we’ve been following. That alone is Bullish, yet there was a reversal from earlier gains for the Bulls in volatility terms. The “volatility decision” has yet to be fully made about which way the market will turn from here.
The earnings season was strong, and yet companies like Intel have said they are not sure how solid the second half of the year will be. This uncertainty is leading to tentative trading, but overall, the Bulls have a slight edge. Until that changes, I would recommend maintaining a Bullish stance, perhaps with somewhat less exposure, as is the case for me at the moment. You can see my recent messages on my exposure level at the links just below.
Keep up-to-date during the week at Twitter and StockTwits (links below), where a combined 33,480 people are joining in…
Follow Me on Twitter®. Follow Me on StockTwits®.
SP500 Large Cap Index (click chart to enlarge; SPX, SPY):

SP500 Index still, but barely, above the pivot.
Survey Says! Sentiment of individual investors (AAII.com) showed a Bull minus Bear percentage spread of +13.40% vs. +16.10% the prior week. Sentiment is not at an extreme, so it is not particularly useful at this point.
| AAII.Com Individual Investor Sentiment Poll | ||
| Bulls | Neutrals | Bears |
| 38.56% | 36.27% | 25.16% |
| Thurs. 12 am CT close to poll | ||
2. U.S. Small Caps Market Timing (IWM): The breakout is intact, and I have added to my position on the small pullback. I would not like to see a reversal below the last breakout at this point.
Russell 2000 U.S. Small Cap Index (click chart to enlarge; IWM, RUT):

Small cap breakout still there.
3. Gold Market Timing (GLD): The US dollar has moved up, but rates have eased just slightly, and that was enough to move GLD up a bit, but not enough to matter. GLD will have to rise above 124.10 to change the picture.
The Gold ETF (click chart to enlarge the chart; GLD):
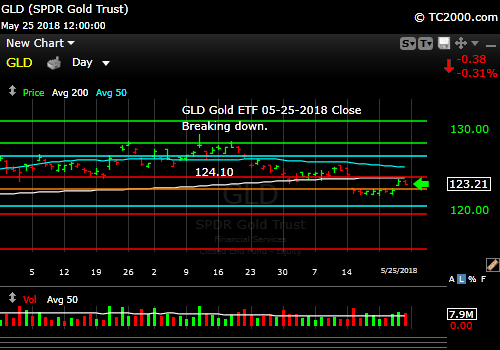
Gold Chart Bearish still.
4. Interest Rate Market Timing – U.S. 10 Year Treasury Note Yield (TNX): Rates have eased back below the 2.944% low, but further progress is needed below 2.911%. The 30 Year Treasury Bond Yield is in the same position and is within 0.01% of breaking to a new low.
First review the rate chart below and then look at the signal updates…
U.S. 10 Year Treasury Note Yield (click chart to enlarge; TNX, IEF, TYX,TLT,TBF):

Rates easing.
Now let’s review three key market timing signals together….
Do not use these signals as a trading plan. They are rough guidelines. I currently share my own moves on social media (links above).
MY SIGNAL AND TREND SUMMARY for a Further U.S. Stock Market Rally with GDP Growth and Low Inflation:
Stock Signal GREEN with a Bullish SP500 Index trend. The SPX retook the 4-18 high and the VIX dropped below 13.31.
Gold Signal GREEN with a Bearish Gold Trend. Gold broke down to new lows and the trend is down. See test above.
Remember GLD is being used as an indicator for the ECONOMY here. The new recent LOW in GLD turned the signal GREEN.
Rate Signal YELLOW with a Bullish 10 Year Yield Trend. The loss of the last breakout is significant, but another push lower is needed to take out the last low.
I have been calling rising rates a “positive” thing for U.S. stock market gains as that is what normally happens in the late stage of recovery, yet the current situation is very abnormal. For this reason, I will call rates above my 2.676% number, but below the 3.036% prior breakout YELLOW. “Bullish” for yields is Bearish for bonds and vice versa. There is a twist here. This level of the 10 Year Treasury Yield, which is too high for current conditions as explained HERE, will eventually slow the economy. The market will likely be far happier if rates stay within a lower range, while not too low and not too high.
Note: I’ve updated my criteria for the equity signal for a further U.S. stock market rally to the following: GREEN = Bullish, YELLOW = Neutral, RED = Bearish. In other words, the colors tell you whether the signal supports the stock rally or not, while the Bullish, Neutral, and Bearish designations are about the trend.
Explanation: Note that a BEARISH signal does not mean we should not buy. A BULLISH signal does not mean you cannot sell some exposure. It depends on what is going on in the economy and how oversold/overbought the market is at a given point whether the Bearish signal is to be sold, sold on the next bounce, etc. and whether a Bullish signal is to be bought or if profits should be taken. A NEUTRAL signal does not mean the end of the Bull or Bear. It means to wait and look for possible subsequent entry points within the existing trend, Bull or Bear, but preserve capital if the entry fails. Our strong intention is to buy low and sell high. By the way, I will keep showing the prior orange “Trigger lines” in the charts for now as reference points only; they have historical value for us from the post-2016 election period.
Thank you for reading. Would you please leave your comments below where it says “Leave a Reply”… or ask a question… Pay it forward too by sending the link to MarketTiming.Blog (that link will immediately connect them to this webpage) to a relative or friend. Thanks for doing that.
Be sure to visit the website for more general investing knowledge at:
Standard Disclaimer: It’s your money and your decision as to how to invest it.
I thank Worden Brothers for the charting system I use to post these charts. If you want to know more about the charting system I use every day, go to my “Other Resources” page here: Other Resources It makes it much easier to follow along with me if you can see the charts and manipulate them on your own computer. It’s a great investment to have an excellent charting system. Check it out with a free trial at the link above.
Finally: Excuse and report all typos if you are so moved. I do my best to pick up most of them, but can’t find them all. Shoot me a comment (I don’t have to post your typo report as I filter them, but I’ll be grateful to you!)
Copyright © 2018 By Wall Street Sun and Storm Report, LLC All rights reserved.
