
A Market Timing Report based on the 06-01-2018 Close, published Sunday, June 3rd, 2018…
I deliver focused comments on market timing once or twice a week. These are supplemented with daily “Tweets/StockTwits” (see links below).
1. SP500 Index Market Timing (S&P 500 Index®; SPY, SPX): What did the Intel-igent Signal say this week? INTC closed at 57.08 for the week with the breakout at 54.36. The signal is now again positive for a continued large cap rally after reversing previously. This is despite warnings from the company itself that the second half of the year could show slowing growth.
I warned you last week about the Bank of America signal, and it has continued to fall vs. the prior week, but has for the moment bounced off the May low, which is below the February low, where the S&P500 Index bottomed. BAC is also just above the February low as well.
The SP500 Index is still above that key 4-18 top at 2717.49 approaching the higher high of 2742.24, the next test of Bullish interest in buying. The VIX volatility index closed Friday at 13.46, above the Bullish 13.31 target we’ve been following; hence, the “volatility decision” has yet to be fully made about which way the market will turn from here, but the Bulls have more of an edge now, and sentiment is cooperative as you’ll see below…
One advantage now about investing in the U.S. is that European, Japanese, and Chinese growth rates are slowing. You may say “China is still growing faster than the U.S!” yet, that’s not how the market looks at it. A faster rate of growth is already priced into the market and if the growth rate slows, PEs must compress further regardless of the absolute level of earnings and revenue growth.
The U.S is “the best place in town” to invest…and with a rising U.S. dollar, it’s even better for foreign investors to buy U.S. stocks denominated in U.S. dollars. The challenge down the road will be slowing profits for U.S. multinationals in those slowing economies. When the U.S. could catch an economic cold is a question we need to keep in mind in relation to our exposure level to U.S. stocks.
Keep up-to-date during the week at Twitter and StockTwits (links below), where a combined 33,495 people are joining in…
Follow Me on Twitter®. Follow Me on StockTwits®.
SP500 Large Cap Index (click chart to enlarge; SPX, SPY):

That last retracement test worked!
Survey Says! Sentiment of individual investors (AAII.com) showed a Bull minus Bear percentage spread of +8.67% vs. +13.40% the prior week. Sentiment is still not at an extreme, which means we can still add to stock holdings at these levels, because many investors are still skeptical. Investors became marginally MORE Bearish as the SP500 Index ROSE! That is Bullish.
| AAII.Com Individual Investor Sentiment Poll | ||
| Bulls | Neutrals | Bears |
| 35.02% | 38.63% | 26.35% |
| Thurs. 12 am CT close to poll | ||
2. U.S. Small Caps Market Timing (IWM): The breakout is still intact, and I’ve added once again to my growing position. Small caps will be a major part of the last big blow off top in the U.S. markets.
Russell 2000 U.S. Small Cap Index (click chart to enlarge; IWM, RUT):

Small caps have an edge with the strengthening U.S. dollar.
3. Gold Market Timing (GLD): I would expect U.S. Treasury rates to move up a bit more from here as U.S. inflation gradually rises, but not if Italy is falling apart, so playing rates here is a tricky business. The U.S. dollar strength due to higher rates, European instability, and slower economic growth abroad are reasons gold could suffer, yet gold could benefit from a flight from the Euro if the Italy story worsens. Still, it’s hard to make money trading gold against a strong U.S. dollar except for times of outright panic.
The Gold ETF (click chart to enlarge the chart; GLD):
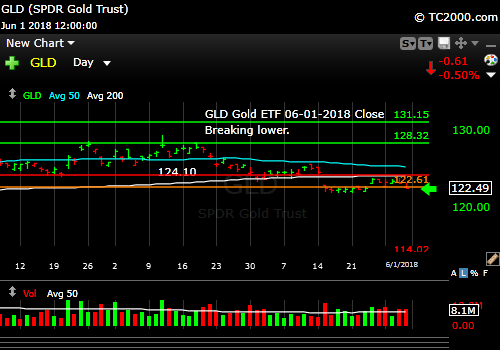
Gold is still fighting higher U.S. rates and a stronger U.S. dollar.
4. Interest Rate Market Timing – U.S. 10 Year Treasury Note Yield (TNX): The 10 Year Yield rose a bit last week after a bigger fall. For now, the 2.717% low is the Bond Bull target and 2.943% is the Bond Bear target to be captured.
First review the rate chart below and then look at the signal updates…
U.S. 10 Year Treasury Note Yield (click chart to enlarge; TNX, IEF, TYX,TLT,TBF):

Rates rising or falling? Lower than last week but bouncing.
Now let’s review three key market timing signals together….
Do not use these signals as a trading plan. They are rough guidelines. I currently share my own moves on social media (links above).
MY SIGNAL AND TREND SUMMARY for a Further U.S. Stock Market Rally with GDP Growth and Low Inflation:
Stock Signal GREEN for a further U.S. stock market rally with a Bullish SP500 Index trend. The SPX retook the 4-18 high and the VIX dropped below 13.31.
Gold Signal GREEN for a further U.S. stock market rally with a Bearish Gold Trend.
Remember GLD is being used as an indicator for the ECONOMY here.
Rate Signal YELLOW for a further stock market rally with a Bearish 10 Year Yield Trend. TNX must rise above 2.911% to turn back to neutral and above 2.943% to turn back to Bullish.
I have been calling rising rates a “positive” thing for U.S. stock market gains as that is what normally happens in the late stage of recovery, yet the current situation is very abnormal. For this reason, I will call rates above my 2.676% number, but below 2.943% YELLOW. “Bullish” for yields is Bearish for bonds and vice versa. There is a twist here. This level of the 10 Year Treasury Yield, which is too high for current conditions as explained HERE, will eventually slow the economy. The market will likely be far happier if rates stay within a lower range, while not too low and not too high.
Note: I’ve updated my criteria for the equity signal for a further U.S. stock market rally to the following: GREEN = Bullish, YELLOW = Neutral, RED = Bearish. In other words, the colors tell you whether the signal supports the stock rally or not, while the Bullish, Neutral, and Bearish designations are about the trend.
Explanation: Note that a BEARISH signal does not mean we should not buy. A BULLISH signal does not mean you cannot sell some exposure. It depends on what is going on in the economy and how oversold/overbought the market is at a given point whether the Bearish signal is to be sold, sold on the next bounce, etc. and whether a Bullish signal is to be bought or if profits should be taken. A NEUTRAL signal does not mean the end of the Bull or Bear. It means to wait and look for possible subsequent entry points within the existing trend, Bull or Bear, but preserve capital if the entry fails. Our strong intention is to buy low and sell high. By the way, I will keep showing the prior orange “Trigger lines” in the charts for now as reference points only; they have historical value for us from the post-2016 election period.
Thank you for reading. Would you please leave your comments below where it says “Leave a Reply”… or ask a question… Pay it forward too by sending the link to MarketTiming.Blog (that link will immediately connect them to this webpage) to a relative or friend. Thanks for doing that.
Be sure to visit the website for more general investing knowledge at:
Standard Disclaimer: It’s your money and your decision as to how to invest it.
I thank Worden Brothers for the charting system I use to post these charts. If you want to know more about the charting system I use every day, go to my “Other Resources” page here: Other Resources It makes it much easier to follow along with me if you can see the charts and manipulate them on your own computer. It’s a great investment to have an excellent charting system. Check it out with a free trial at the link above.
Finally: Excuse and report all typos if you are so moved. I do my best to pick up most of them, but can’t find them all. Shoot me a comment (I don’t have to post your typo report as I filter them, but I’ll be grateful to you!)
Copyright © 2018 By Wall Street Sun and Storm Report, LLC All rights reserved.
