A Market Timing Report based on the 06-22-2018 Close, published Sunday, June 24th, 2018…
I deliver focused comments on market timing once or twice a week. These are supplemented with daily “Tweets/StockTwits” (see links below).
1. SP500 Index Market Timing (S&P 500 Index®; SPY, SPX): Let’s check in on two signals we’ve been following:
“Intel-igent Signal”: Negative. The trigger point is 54.36 and the close Friday was 52.50, despite INTC guiding earnings for the current quarter upward. There was also the small thing of the CEO being forced out for fraternizing with an employee in the age of #MeToo ethical standards. It was also an Intel rule, and he violated it, so he’s out. This may taint this “tell” on the market a bit, as the CEO had been doing good things in redirecting the companies efforts more away from the PC toward data centers or as it is better marketed to stockholders – “the Cloud”! The CFO supposedly knows what the company needs in the meantime as they search for the next CEO.
Remember that INTC was supposed to be our “tell” on what the second half of the year in tech could look like in terms of earnings. They had warned on possible weakness in the second half as noted HERE. Despite the CEO issue, I believe the market will look past it to the company’s performance, although there could be some degree of damage. The Q2 earnings season starts with Pepsi (PEP) on July 10th followed by JPM, C, WFC, and PNC banks on Friday July 13th.
Bank of America (BAC) signal: Negative. The BAC low in Feb. was 29.13 and the close Friday was 28.99 with small caps and the QQQ – the latter not all tech, but heavy in tech at new all time highs, although that is barely the case for QQQ, as the Trump Trade War heats up. The QQQ close Friday was 175.32, while the breakout was at 175.21. XLK which is “pure tech” in the SPX is below the breakout at 71.34 with a close Fri. of 70.80.
I had said, “We’ll keep an eye on whether BAC can hold the prior recent major lows. If not, a greater decline in interest rates would be expected.” I believe interest rates will fall further in the U.S. as global deceleration of growth sinks in. This will temper the gains in the U.S. perhaps, but remember that the U.S. is among the strongest economies left, so money has rotated into the U.S. from abroad. That’s exactly what I did near the Feb. lows, and it has paid off. The U.S. market has recovered while Europe, Japan, and China ETFs have lagged very badly. FXI (China Big Cap) is BELOW the Feb. low. EWJ, which is the Japan ETF is near the Feb. low, and Europe (VGK) is as well. Studies have shown that when markets diverge, you can do better by concentrating your investment in the strongest countries rather than just going to cash.
Last week I pointed out: “The SP500 Index is hugging the upper trend line of the 2017 channel. This is not a problem, but it allows for a pullback within the trend without ending it.” I also said it was a place you could “Take some off” if you are overinvested in stocks. What happened is the market did pull back from that channel top a bit, but it’s only down about 21.1% from the top of the channel. It could slide further, depending on the trajectory of the tariff disputes Trump is engaged in.
The midcaps, QQQ, and XLK, all among the leaders, are back down below their prior breakout points. Small caps are 4.47% above their breakout on the other hand. A breakdown there would be an extremely negative sign for the market, because the thesis there has been that the U.S. economy can be very strong domestically, even if foreign predominantly large cap sales suffer from the trade disputes. If that’s not the case, then the supposition is that the large cap suffering is going to spill over into all stocks, even the small caps. There is no definitive break yet in the midcaps either though, despite being belong the breakout point.
The loss of key breakouts noted as well as negative INTC and BAC signals, as well as a breach of that yellow up trend line shown in the SP500 Index chart below indicates something more than a couple day dip is in store for the market. The other softer sign of a “problem” is that some stocks like Netflix are up 34.08% since my buy on 4-24-18. At this rate, by 4-23-19, NFLX will be at 918 for a gain of 200.6%. Does that seem likely? Possible perhaps in a nutty world, but not likely, so some sort of pullback is needed along that path. If you have no cash, this may be the time to raise a bit, so you can buy stocks back lower this summer.
One warning though: Don’t sell your winners unless it is to take some modest profits off the table, but do it on a stop loss basis for a strong stock like NFLX. And be sure the company you buy is as good as or better than the one you sell. If not, why are you selling? To de-worsify? To buy cheap companies that may take years to turn around?
Sell your losers first to raise cash and get a list ready to redeploy the assets into strong companies with strong balance sheets and a high return on equity, one of the top criteria Warren Buffett uses to identify great companies with a consistent operating history. Why is that? It is because earnings mean nothing if a company does not create shareholder value from those earnings. Buffett states that a company should be able to create at least $1 in value for every $1 of retained earnings.
Keep up-to-date during the week at Twitter and StockTwits (links below), where a combined 33, 540 people are joining in…
Follow Me on Twitter® Follow Me on StockTwits®.
SP500 Large Cap Index (click chart to enlarge; SPX, SPY):
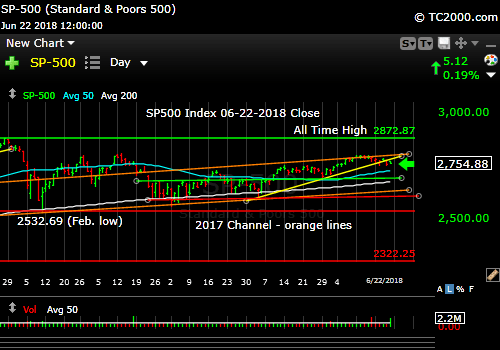
Just a dip or more?
Survey Says! Sentiment of individual investors (AAII.com) showed a Bull minus Bear percentage spread of +12.54% vs. +23.08% vs. the prior week. I said last week: “This is compatible with a continued Bull move, but allows for a dip of a few percent (say 3%) or a period of consolidation.” We’re down only a little so far. Sentiment in this range says there is room for both downside and upside, so it’s not that helpful. We are not at a pivot point in sentiment terms, which is just one parameter I follow.
| AAII.Com Individual Investor Sentiment Poll | ||
| Bulls | Neutrals | Bears |
| 38.72% | 35.10% | 26.18% |
| Thurs. 12 am CT close to poll | ||
2. U.S. Small Caps Market Timing (IWM): As said above, the small cap breakout must be maintained or a big crack in the continued U.S. expansion will be exposed. Follow these signals with me on social media (links above).
Russell 2000 U.S. Small Cap Index (click chart to enlarge; IWM, RUT):

Small caps lead still.
3. Gold Market Timing (GLD): I believe the current gold decline is temporary, due to a miscalculation by the Federal Reserve. They are raising rates into a global deceleration and will be forced to at least hold off from further hikes after a Sept. hike, as I discussed last week (links to past issues to upper right). When they become less hawkish on inflation, the U.S. dollar and long rates will both be falling and gold will rise again. It’s a bad trade for now, but the reversal is coming.
The Gold ETF (click chart to enlarge the chart; GLD): Weak!
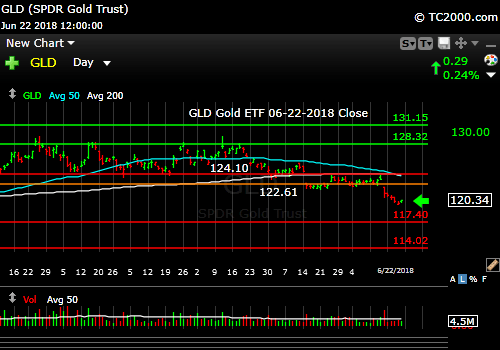
Gold is still weak and may be for weeks to months.
4. Interest Rate Market Timing – U.S. 10 Year Treasury Note Yield (TNX): Rates are mid-range as the chart shows and could move a bit higher on inflation news and lower on global deceleration news. Seems too hard to trade to bother, but there are always those who do.
U.S. 10 Year Treasury Note Yield (click chart to enlarge; TNX, IEF, TYX,TLT,TBF):

The 10 Year Yield is in the middle of the recent range.
Now let’s review three key market timing signals together….
Do not use these signals as a trading plan. They are rough guidelines. I currently share my own moves on social media (links above).
MY SIGNAL AND TREND SUMMARY for a Further U.S. Stock Market Rally with Real GDP Growth (“real” means above inflation):
Stock Signal GREEN for a further U.S. stock market rally with a Bullish SP500 Index trend. The VIX closed at 13.77, above the key 13.31 number I have pointed out. The close was 11.98 last week and 12.18 the prior Friday. A rise above 14.57 would be a concern for a more serious correction, although on Thursday the high was 15.18, so a quick test above is not enough to tip the market over.
Gold Signal GREEN for a further U.S. stock market rally with a Bearish Gold Trend.
Remember GLD is being used as an indicator for the ECONOMY here.
Rate Signal YELLOW for a further stock market rally with a NEUTRAL 10 Year Yield Trend. Things have changed due to the recent swoon and then bounce in rates. A more definitive rise above 3.036% would turn the rate trend back to Bullish (bearish for bonds). A fall below 2.717% would be required to turn the rate trend back to Bearish. “Bullish” for yields is Bearish for bonds and vice versa. This level of the 10 Year Treasury Yield, which is too high for current conditions as explained HERE, will eventually slow the economy. The market seems to have adjusted to rates of up to 3% or so as said in the signal summary HERE.
Note: I’ve updated my criteria for the equity signal for a further U.S. stock market rally to the following: GREEN = Bullish, YELLOW = Neutral, RED = Bearish. In other words, the colors tell you whether the signal supports the stock rally or not, while the Bullish, Neutral, and Bearish designations are about the trend.
NOTE: A BEARISH trend signal does not mean we should not buy. A BULLISH signal does not mean you cannot sell some exposure. It depends on what is going on in the economy and how oversold/overbought the market is at a given point whether the Bearish signal is to be sold, sold on the next bounce, etc. and whether a Bullish signal is to be bought or if profits should be taken. A NEUTRAL signal does not mean the end of the Bull or Bear. It means to wait and look for possible subsequent entry points within the existing trend, Bull or Bear, but preserve capital if the entry fails. Our strong intention is to buy low and sell high. By the way, I will keep showing the prior orange “Trigger lines” in the charts for now as reference points only; they have historical value for us from the post-2016 election period.
Thank you for reading. Would you please leave your comments below where it says “Leave a Reply”… or ask a question… Pay it forward too by sending the link to MarketTiming.Blog (that link will immediately connect them to this webpage) to a relative or friend. Thanks for doing that.
Be sure to visit the website for more general investing knowledge at:
Standard Disclaimer: It’s your money and your decision as to how to invest it.
I thank Worden Brothers for the charting system I use to post these charts. If you want to know more about the charting system I use every day, go to my “Other Resources” page here: Other Resources It makes it much easier to follow along with me if you can see the charts and manipulate them on your own computer. It’s a great investment to have an excellent charting system. Check it out with a free trial at the link above.
Finally: Excuse and report all typos if you are so moved. I do my best to pick up most of them, but have not always found them all. Shoot me a comment (I don’t have to post your typo report as I filter them before publication, but I’ll be grateful to you!)
Copyright © 2018 By Wall Street Sun and Storm Report, LLC All rights reserved.

Good morning and thank you!
You are welcome Charles! Thanks for reading and most of all USING the information in a way that fits your own plan.