A Market Timing Report based on the 06-29-2018 Close, published Sunday, July 1st, 2018…
I deliver focused comments on market timing once or twice a week. These are supplemented with daily “Tweets/StockTwits” (see links below).
1. SP500 Index Market Timing (S&P 500 Index®; SPY, SPX): Let’s check in on two signals we’ve been following:
“Intel-igent Signal”: Negative. The inflection point is 54.36, and the close Friday was 49.71, 8.56% off that point. INTC is our “tell” on second half earnings in tech. They had warned on possible weakness in the second half as noted HERE. Earnings start on July 10th as mentioned last week with several big banks reporting on July 13th.
Bank of America (BAC) signal: More Negative than last week. The BAC low in Feb. was 29.13 and the close Friday was 28.19, 3.33% below that low. The failure of a rally after the announcement higher dividends and buybacks would be allowed at the big banks by the Federal Reserve makes it even more negative. The fact that financials are not coming along for the recovery, means the recovery’s momentum is in doubt. Lack of economic momentum means lack of earnings growth momentum,which leads to failing stock market momentum.
Two weeks ago I pointed out: “The SP500 Index is hugging the upper trend line of the 2017 channel. This is not a problem, but it allows for a pullback within the trend without ending it.” I also said it was a “place you could ‘Take some off’ if you are overinvested in stocks.” Yes, that was right.
This was my conclusion last week: “The loss of key breakouts noted as well as negative INTC and BAC signals, as well as a breach of that yellow up trend line shown in the SP500 Index chart below indicates something more than a couple day dip is in store for the market. (see chart in last week’s post; link to upper right).” The dip started right at the open on Monday.
If the general up trend is to survive. there are two possible outcomes in the near term.
- We descend in an A (down) – B (consolidation) – C (down) fashion with C ending at worst at the orange line in the chart below that represents the base of the 2017 channel. Other choices include the 200 day moving average or the May 29 low. I would prefer to see the May 29th low hold as if it does not, there will be a lower low, which could signal to many investors that the prior down trend has resumed. The last high achieved on 6-13-18 intraday was a lower high vs. the Feb. and March highs. No one will argue with this: “A downtrend is established by a series of lower lows and lower highs.”
- The caveat I’ll share here is the May 29th low was not truly a legitimate low in the trend, as it consisted of a one day test below the prior consolidation support.
- Conclusion: The trend will remain intact as long as the orange up trend line is held or if 2594.62 holds, which is the May 3rd low.
- The No C Wave Option: The 2698.67 initial low of the current consolidation, which was tested twice with slight breaches, is challenged again, but no more. 2691.99 would have to hold at worst.
Both of those scenarios are possible. The bigger sell-off is a risk particularly given the messy nature of Trump’s public trade negotiation with “shots fired” on our trading partners.
I have cash to take advantage of any further dip as delineated on my social media feeds (links below)…
We are heading into a mid-week holiday with normally positive seasonality and the U.S. Jobs number coming out on Friday should say things are still going well in the U.S. That will help the dollar and particularly U.S. Small Caps. Remember, the Fed is no longer focused on jobs; it is focused on inflation and financial stability.
The SP500 Index trend now? I consider it “Neutral,” due to the lower highs and higher lows. Within that neutral trend, the 2017 up trend is still intact. It will break though, if “global deceleration” infects the U.S.
Keep up-to-date during the week at Twitter and StockTwits (links below), where a combined 33, 557 people are joining in…
Follow Me on Twitter® Follow Me on StockTwits®.
SP500 Large Cap Index (click chart to enlarge; SPX, SPY):

Just a quick “Summer Dip” or more?
Survey Says! Sentiment of individual investors (AAII.com) showed a Bull minus Bear percentage spread of -12.25 vs. +12.54% the prior week. There is still room for more downside, despite the drop this week. The recruitment of 14.62% more Bears this week says that Bears are being converted on this swoon and more could join them. Realize both sentiment, and the markets could turn very quickly on any Trump chatter about trade solutions. In conclusion: This level of sentiment spread is not that useful. I’ll tell you when it is…
| AAII.Com Individual Investor Sentiment Poll | ||
| Bulls | Neutrals | Bears |
| 28.45% | 30.75% | 40.80% |
| Thurs. 12 am CT close to poll | ||
2. U.S. Small Caps Market Timing (IWM): Small caps are also mid-channel, but off a new all time high. The dollar is still trending up. UUP made a new high this week and pulled back just a bit. This could continue as the rest of the world prints softer economic numbers, and the U.S. prints decent growth numbers for both GDP and company earnings. Money flow to where growth is in the world.
Dollar strength means small caps could continue to be favored still over large caps. Unfortunately, both small and large caps are in decline of late. Be sure you are not holding companies with falling earnings expectations, as they will tank the fastest.
Although small caps remain stronger than large caps, given the breakout to a new all time high, optimally, that breakout must be maintained.
The increase of volume on the recent drop is a negative (see green volume arrow below). As stated, small caps are mid-channel, so the base of the channel can come into play with survival of the up trend in small caps. (lower magenta line).
Russell 2000 U.S. Small Cap Index (click chart to enlarge; IWM, RUT):

Must maintain the prior breakout.
3. Gold Market Timing (GLD): Falling rates say the Fed’s course in raising short rates is wrong, but gold declined some more this week. The bigger turn will come when the Federal Reserve is forced to reverse their hawkish stance and move to neutral initially, then potentially back to dovish again if the global picture drives them there. If things get bad enough prior to the September meeting, they won’t hike, and gold will already be rising.
The Gold ETF (click chart to enlarge the chart; GLD):
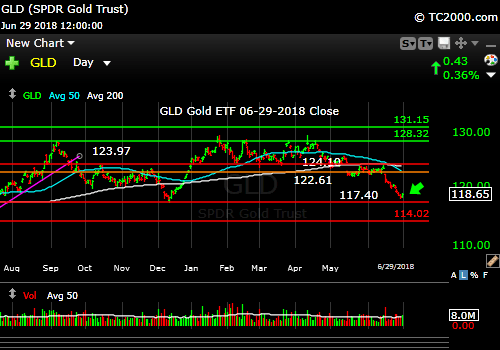
Gold slump continues. Waiting for a Fed reversal.
4. Interest Rate Market Timing – U.S. 10 Year Treasury Note Yield (TNX): The 10 Year Yield is being buffeted by both inflation worries due to higher employment in the U.S. (a late cycle issue) and global deceleration. The yield is now at the lower end of the recent range of 2.717% to 3.115%. All this says bonds won’t do as badly as the pundits had predicted they would, at least for now.
U.S. 10 Year Treasury Note Yield (click chart to enlarge; TNX, IEF, TYX,TLT,TBF):

Rates in the lower end of their recent range.
Now let’s review three key market timing signals together….
Do not use these signals as a trading plan. They are rough guidelines. I currently share my own moves on social media (links above).
MY SIGNAL AND TREND SUMMARY for a Further U.S. Stock Market Rally with Real GDP Growth (“real” means above inflation):
Stock Signal GREEN for a further U.S. stock market rally with a NEUTRAL SP500 Index trend. GREEN because the IWM up trend is still intact, and I originated this signal with the small not large caps. The VIX closed at a “Bears Mean Business level” of 16.09, above the key 13.31 number I have pointed out. That’s why I expect another test is coming per the above delineated scenarios.
Gold Signal GREEN for a further U.S. stock market rally with a BEARISH Gold Trend.
Remember GLD is being used as an indicator for the ECONOMY here.
Rate Signal YELLOW for a further stock market rally with a NEUTRAL 10 Year Yield Trend. Things have changed due to the recent swoon and then bounce in rates. A more definitive rise above 3.036% would turn the rate trend back to Bullish (bearish for bonds). A fall below 2.717% would be required to turn the rate trend back to Bearish. “Bullish” for yields is Bearish for bonds and vice versa. This level of the 10 Year Treasury Yield, which is too high for current conditions as explained HERE, will eventually slow the economy. The market seems to have adjusted to rates of up to 3% or so as said in the signal summary HERE.
Note: I’ve updated my criteria for the equity signal for a further U.S. stock market rally to the following: GREEN = Bullish, YELLOW = Neutral, RED = Bearish. In other words, the colors tell you whether the signal supports the stock rally or not, while the Bullish, Neutral, and Bearish designations are about the trend.
NOTE: A BEARISH trend signal does not mean we should not buy. A BULLISH trend signal does not mean you cannot sell some exposure. It depends on what is going on in the economy and how oversold/overbought the market is at a given point whether the Bearish signal is to be sold, sold on the next bounce, etc. and whether a Bullish signal is to be bought or if profits should be taken. A NEUTRAL trend signal does not mean the end of the Bull or Bear. It means to wait and look for possible subsequent entry points within the existing trend, Bull or Bear, but preserve capital if the entry fails. Our strong intention is to buy low and sell high. By the way, I will keep showing the prior orange “Trigger lines” in the charts for now as reference points only; they have historical value for us from the post-2016 election period.
Thank you for reading. Would you please leave your comments below where it says “Leave a Reply”… or ask a question… Pay it forward too by sending the link to MarketTiming.Blog (that link will immediately connect them to this webpage) to a relative or friend. Thanks for doing that.
Be sure to visit the website for more general investing knowledge at:
Standard Disclaimer: It’s your money and your decision as to how to invest it.
I thank Worden Brothers for the charting system I use to post these charts. If you want to know more about the charting system I use every day, go to my “Other Resources” page here: Other Resources It makes it much easier to follow along with me if you can see the charts and manipulate them on your own computer. It’s a great investment to have an excellent charting system. Check it out with a free trial at the link above.
Finally: Excuse and report all typos if you are so moved. I do my best to pick up most of them, but have not always found them all. Shoot me a comment (I don’t have to post your typo report as I filter them before publication, but I’ll be grateful to you!)
Copyright © 2018 By Wall Street Sun and Storm Report, LLC All rights reserved.

Thank you David, I have a friend that wants to read your post so i’ll Send the link to him. The markets are hanging by a Trump tweet! At some point the tweets won’t matter as investor confidence around the world give way to the New reality in America! Protectionism, 21,000 businesses seeking exemptions from the trade tariffs with seven approved! What is a free market today? Who decides which companies are exempt and what is the criteria? This is a mess and no one should be allowed to have this level of power over the markets!
Yes. The tariff numbers seem arbitrary. 25% for steel, 10% for aluminum? Where do those numbers come from?
I do agree with the need to protect American technology from piracy. China, and all others for that matter, need to protect those intellectual property rights, or the tech industry will suffer from not being paid properly for advancements.
Thanks for sharing the blog link! Always good to pay it forward by spreading the word on how to be a conscious investor…