A Market Timing Report based on the 10-12-2018 Close, published Sunday, October 14th, 2018…
I deliver focused comments on market timing once or twice a week. These are supplemented with daily “Tweets/StockTwits” (see links below).
1. SP500 Index Market Timing (S&P 500 Index®; SPY, SPX):
Last week I said: “As I also warned you, small caps were saying investors were seeing rising risk in owning small cap, higher beta and higher momentum stocks…and they came crashing down this week.”
I also said, “The key to understanding ‘what is really going on’ is interest rates. They have been ramping up since the August low, and this week the rise accelerated, and went past the prior May high of 3.115%.” This rate shock is what I called “#RateShockII.” It happened before at the end of January.
And I said: “The next logical target if rates don’t simmer down or earnings projections sour (big banks start reporting next Friday Oct. 12)? About a 6% fall for the SP500 Index to test the 200 day moving average.”
Now that has actually taken place with the SP500 Index less than one point above its 200 day moving average (mav), these are two of the critical MUST signals that I will be watching with you over the next several days to weeks…
What MUST ideally happen to “save this market” from another possibly greater decline:
MUST #1. Small (IWM) and Midcap (IJH) stocks cannot reach significantly lower lows from here or the SP500 Index will follow them down to at least test the February low in my view. The higher lows achieved in April and May serve as higher targets, but I’d put my money on the Feb. low, and be prepared to add at those two higher lows (April/May) if the market ends up looking good for a bounce from there.
The SP500 Index closed at less than a point above the 200 day mav as said, so this is a decision point for many investors who follow it. Being there of course does NOT tell you whether it will hold, but it must hold is what I’m saying.
The next SP500 Index target to the downside is 8.35% lower if these levels do not hold.
I do not intend to ride my entire exposure down that low, but you can do what you feel is best. I will likely lower my exposure from the current level (stated at the social media links below) to 70% of my usual maximum exposure for a Bull market at least. (someone asked me what this meant on Friday and you can find the answer on my Twitter or StockTwits feeds).
Remember I started at 100% of maximum exposure at the January high and have sold enough exposure already to make a difference. The idea of “Passive Shorting,” a term I coined, is to SELL high and buy LOW, instead of riding the big waves down. Read about it HERE.
MUST #2 A. The second thing that must happen is rates must ease further and slice down through that prior high I’ve been following with you at 3.115%. The close Friday was at 3.141%. That means the test of the breakout is only 2.6 basis points lower from the close on 10-12-18. (1 percent = 100 basis points, or bp abbreviated).
This week rates eased a bit, which is helpful as #RateShock was a major issue for the market in the current sell-off. I went over my concept of “#RateShock” in the 2-09-18 issue: HERE (see section 3 on gold). Rates WERE rising too fast for the current context of Ex-US slowing with extremely low rates still in both the EU and in Japan and accommodative currency games being played by China. Even at current levels, this means that this rise in U.S. rates is actually contractionary rather than accommodative in relative terms.
We must watch oil with the 10 Year Treasury Yield, because it is a major driver of inflation, despite what the Fed tells you about oil costs being transient.
“MUST #2 B.” Oil must keep coming down or at least stay below the lower high formed on the WTI Oil chart I posted last Friday on social media.
I realize it is hard for many of you to trade quickly if you have assets tied up in mutual funds. Even if this level of the market were to hold, it is unlikely it will hold on a single V shaped bounce. IF the market breaks further to the Feb. lows, that could provide the impetus for a strong bounce as well, especially if it happens quickly.
If the whole move down is 8.35%, then selling on a 4% down day may not be fruitful if the next day the target is hit and the market reverses. You’ll have to make your own judgment on when and how much to sell based on your cash needs in the next couple of years, and certainly, you will also have to get back in if your timing is wrong. “Your timing” you notice, not mine. I provide the guidelines to help you look at the market the way the mainstream media often fails to (more on that another time…), but YOU have to live with your decisions.
That comment about the media is of course with the exception of MarketWatch, which in a Monday morning market preview by Barbara Kollmeyer at 9:38 a.m., included a link to my Sunday 10-08-2018 post HERE. 😉 I wonder if anyone read it and sold stocks on Monday? If you did, please comment below.
Over the past several weeks, I told you to “sell some.” I repeated my lower exposure levels numerous times on social media. I sold SP500 exposure before the last fall. I’ve been switching some SPY (SP500 ETF) exposure for XLV Healthcare exposure that has been doing a bit better than the SPY. I told you to sell high risk stocks and ETFs etc. before the latest fall. Many of you may have ignored what I said, but I said it.
Learn to read and be present with what you are reading and decide based on your understanding of what was said what you yourself believe and most importantly ask yourself this:
“WHAT ACTIONS AM I GOING TO TAKE OR NOT TAKE BASED ON WHAT I JUST READ?” Inaction is an action.
The above will help you enormously going forward. Read it three times and sit with that question after reading this blog each week and for whatthat matter, anything about investment. On the buy side, how does it help you to read about the “next Microsoft or next Apple” and not invest anything in it if you believe the statement?
I realize you cannot change what you did NOT do, but there are a few other things you CAN do if you decide they are right for you:
Four Actions to Consider…A through D of Managing Market Declines
A. Sell the Bounces. Follow me on social media to learn where the better spots are. THIS IS NOT a good spot to sell unless you need to protect college assets in an SPX fund for example. After the Fri. bounce we are only 6.13% from the top, so you could sell some right here if your cash need is coming up soon. You may be sucked in by the crowd that is already buying high risk stocks back off this week’s lows. Avoid that, unless you know something about the company that convinces you it can “float above the market” (read below about this point). If you’ve been overexposed, this is a chance for you to “sell the bounces,” rather than buy them.
Markets, once they break like this, very often take time to heal (2-3 months at least), and the upcoming slowing of U.S. growth is going to start to take its toll on the market from whatever level investors take it to before digesting that news. Be careful not to ANCHOR on the past. That means believing what you believed before, thinking all is the same. It’s not going to be…in my view.
Growth is NOT enough. I told you in early August, U.S. growth was going to slow. Not below zero growth, which is a recession, but slow. INCREASING growth is what the market pays for, at least at these prices. SLOWING growth is what markets sell. That’s why prices have gotten to these levels in the U.S. Growth WAS on the increase. But you see, once we reach peak GDP and turn down, all the numbers are “less good.” That drives stock prices down.
It’s not complicated, but many investors don’t get it. They think as long as GDP is rising at 2%, all is well. It’s the increase from 2% to 3% that is built into stock prices. And it’s about to turn the other way. The Fed has even predicted the coming GDP decline, as I discussed here previously.
B. Sell Higher Beta, Higher Momentum Stocks and Funds on the Bounces. Replace the exposure sold with SP500 market exposure in part or completely if you do not want your exposure level to fall to the level it otherwise would.
Sell SP500 Index exposure on the bounce too, if you decide your exposure is too high to ride down, should the market step down to the next level as discussed.
I made this a separate point, because I have not just sold some market exposure. I have also lowered risk. You may want to consider doing that on any bounce or perhaps on a further trounce if the bounce is killed off in its infancy.
Decide what exposure level you want here and sell risk, but buy back SPY or the equivalent with PART of the funds to do that. Say you have 50% high risk stocks and 50% SPY now. Sell the 50% high risk (or 25%, if you so decide to hedge your bet) and use half of it to buy SPY, and you’re back to a lower risk at 75% exposure, which is a lower exposure. That’s just one example. Perhaps you want to keep some growth stocks you believe in or even QQQ for example. Your choice. Keep stocks that can continue to hit their targets (more on that later). Few will stay levitated above the market, but some may.
Yes, you may have had more gains if the market goes to brand new all time highs from here, but I am positioning believing that is not the case. At least you won’t miss out entirely on those gains if you switch from high risk to medium risk exposures. If the market goes straight down, the switches won’t MAKE you money to be clear, but you’ll lose less. Cash or short term Treasuries (individual Treasuries, not funds unless they cannot be avoided in a retirement account with your company for ex.) are a good place to wait for the turn.
C. Long Term Treasuries: If interest rates do break down through my target as stated above, buying long term TREASURIES (not corporate debt; corporate debt may work out, but the risk is higher) can provide great returns. This is a TRADE, I want you to realize, because after a fall in rates with falling growth globally, rates will climb again based on a variety of factors including government and corporate debt loads.
You’ll have to move in and then move out at the right time. If rates go straight up and we end up with “Stagflation,” or slower growth and higher inflation, TLT and the like will be punished badly. Then only cash works and very short term debt, where you can reinvest it rapidly as rates rise.
If you do keep corporate bonds, choose those of solid AAA companies, not corporate bond funds if you can help it. When investors leave bond funds, they drag down prices as bonds are not as liquid as stocks. Go back and look at what happened in 2008 if you don’t understand the risk bond funds represent in general.
D. Buy/Hold Companies that Can Sustain Growth Through a Lower Growth Economy: I just pointed out that most growth companies don’t do well in a slower economy. Also, investors often sell an entire sector these days, not individual stocks, so any stock caught up in the selling is less likely to continue its up trend. It could, but that would take a strong investor belief in the company.
That means this a tough task, but an example would be a biotech company with a promising product in phase 3 testing with very positive phase 2 results. A new product like that has demand no matter what. It also entails high risk of course, but that’s what speculations are about. Use a very small percentage of your capital for such speculations. Some say use a half sized position vs. large cap positions you buy. That could be too much. I say use a quarter or an eighth size or less, and spread out your bets, as many fail badly. If you can find companies that will grow whether we are at 1.5% or 3% GDP, great. But watch their charts. They must be outperforming the market. If they don’t, there could be something amiss. Sell speculative stocks that are breaking down in price performance terms.
Now let’s check in on two “Canary Signals” we’ve been following:
“Intel-igent Market Timing Signal” (Intel; INTC): Negative. It closed at 44.88 near the prior September low AFTER a failed rally attempt. I said previously: “46.19 is now the reversal point to watch,” but now it is the 200 day moving average that is the target. It traded up to the 200 day mav and declined. That’s classic behavior for a stock in a Bear market of its own. (Reminder: INTC is our “tell” on 2nd half earnings in tech as noted HERE.)
Bank of America (BAC) Market Timing Signal: Negative. As said, “Similarly BAC has failed to rise above both its 50 and 200 day mav’s, DESPITE the ramp in rates.” Bank earnings were out Friday, and BAC was up far less than the SP500 Index. Even XLF went up ONLY 0.11% vs. 1.42% for SPY! BAC reports on Monday before the open. They had better have good things to say…
Note on the chart below that the 2017 channel line (in orange) served as support, not the 200 day mav (white line on the chart).
Keep up-to-date during the week at Twitter and StockTwits (links below)…
Follow Me on Twitter® Follow Me on StockTwits®.
SP500 Large Cap Index (click chart to enlarge; SPX, SPY):
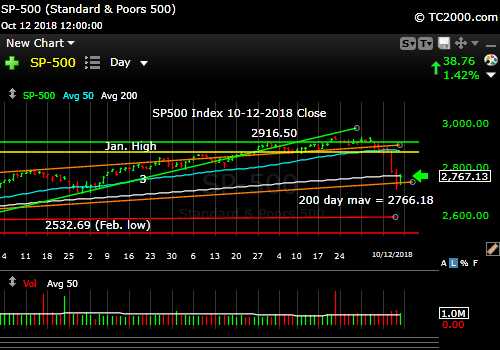
More bounce? Watch the reaction to earnings and rates.
Survey Says! Sentiment of individual investors (AAII.com) showed a Bull minus Bear percentage spread of -4.84% vs. +20.55% last week.
Last week I noted Sentiment was duplicating past tops: “Sentiment peaked at about 20% at both the June 13th and August 29th near highs in the SP500 Index. The pullbacks were very shallow however, only 1.42% in August and only 3.63%. The catch? Interest rates were much lower at those times. Interesting that sentiment made this lower high RIGHT NEAR THE TOP. So that fits with the last high being somewhat significant in sentiment terms. Sentiment is no where near where it got at (actually a couple of weeks BEFORE to be precise) the Jan. 26th, 2018 high however.“
I also said, “The Big Bull market is not likely to die here, but that does not preclude a correction of 6% or even a ‘Mini Bear Market’ as I’ve coined the term HERE of up to a -25% drop.” Read last week’s post if you have not for what would turn this into a “Big Bear Market.”
What does this level of sentiment spread mean? Sentiment after this fall is not a wash out level at all. We can expect far higher numbers at the ultimate low. Still, after a long period of Bullishness, the first fall, which this is, often is met by smaller drops in sentiment as we see here. Conclusion: A bounce can occur, but the selling is not over in my view, based on sentiment alone, which is only one thing we look at. Still, it’s an important clue to add to the rest…
| AAII.Com Individual Investor Sentiment Poll | ||
| Bulls | Neutrals | Bears |
| 30.61% | 33.94% | 35.45% |
| Thurs. 12 am CT close to poll | ||
2. U.S. Small Caps Market Timing (IWM): Small caps I’ve already discussed for this week. They are “high risk.” They and midcaps will also lead the SPX by the nose in the near term, UP or DOWN.
Russell 2000 U.S. Small Cap Index (click chart to enlarge; IWM, RUT):

Small caps told me the market was shaky in advance and will be the key clue on whether the entire market moves lower.
3. Gold Market Timing (GLD): Gold is perking up as the markets around the world started to panic together AND U.S. rates FELL at week end. I’ll leave this warning here: REMEMBER THIS from my last Sept. issue: “As rates fall again, gold may perk up a bit, but the dollar could rally at the same time, blunting the gains from falling rates.” Gold will be tricky to trade, but will do best if a global panic occurs, say around Italy falling apart as previously said.
Read my last few posts to catch up on gold. The move this week says “maybe buy some GLD” as rates are falling. If the dollar rallies too, gold can rise less, so I like Treasuries (provided there is no new high!) better than gold at this point. I own GLD as insurance, so if you own none, you could buy some here (most say up to 5% of investable assets – actually they never say whether they are talking about investable assets or ALL assets including your house, but I’ll say up to 5% investable assets, because that is what I do!) and use a stop below the recent lows. In the gold Bull market, I went to 12% max. of investable assets.
Newcomers should Google: “When does gold shine and when does it decline?” Read the article I wrote, and you’ll know more than most people about how to avoid being a perma gold bug and actually make money on gold. I doubled my gold position at around $380 when Barbra Streisand was shorting it! I sold my entire principle at 1370ish, off the top, yes, but the rest is gravy now.
If gold breaks back down below that red line it’s now testing on a retracement of the breakout, wait for the next breakout above that line to buy it, in my view.
If you buy here, you should consider using the lower red line, the 111.06 level, as your stop, or more aggressively and perhaps better, you could stop out below the 114.87 level (upper red line it is testing) to protect your capital.
The Gold ETF (click chart to enlarge the chart; GLD):

Gold perks up.
4. Interest Rate Market Timing – U.S. 10 Year Treasury Note Yield (TNX):
Buy some TLT for leverage on duration if you wish, but that has not been my choice yet (20+ years; longer term Treasuries). I am using IEF for now (7-10 yr Treasuries), which moves less up and less down until I see the break below my “MUST #2,” the key number of the month or a break of that trend line shown in yellow if you want to buy a bit earlier. I won’t be buying more (likely TLT this time) until my “MUST #2” level is taken out. I may buy some intraday, but I want to move in stages and add on confirmation of a close below it and again on a second close below the number.
SELL if the 10 Year Yield breaks out at least 2 days above the prior high. If the move is fast, you may decide not to wait more than one day. Sometimes markets…change that…OFTEN markets subconsciously seek to fake us all out. Just consider the head fake of the new 2018 high in stocks!!! Yes, the market has a consciousness that is the collective consciousness of all market participants (heavily machine weighted, but the humans program them, so they are human surrogates!).
Check out the “Market Signal Summary” below – after you review the following chart…
U.S. 10 Year Treasury Note Yield (click chart to enlarge; TNX, IEF, TYX, TLT, TBF):

Time to buy Treasuries. Sell if the 10 Year Yield breaks out again.
Now let’s review three key market timing signals together….
Do not use these signals as a trading plan. They are rough guidelines. I currently share my own moves on social media (links above).
MY MARKET SIGNAL AND TREND SUMMARY for a Further U.S. Stock Market Rally with Real GDP Growth (“real” means above inflation):
Stock Signal RED for a further U.S. stock market rally with a BEARISH SP500 Index trend.
Last week I said: “The small caps broke down badly, so the SP500 Index could follow them down (as I said, about 6% from the high to start). The small caps are a better indicator of the health of the economy, as they are most vulnerable to economic changes, and hence, are the basis for this signal.”
One could argue about the SPX trend. If it stays above the lower orange line shown, it is still in the 2017 upward channel; however, it clearly has broken the prior up trend, so let’s call it Bearish with a caveat. In other words, one could say the prior trend was unrealistic, and this one is realistic. If I were Bullish on INCREASING growth going forward, I’d say the market could be fine here. It’s not going to do that it seems. Growth will very likely slow into Q2 of 2019 at least. That’s why I’m selling the bounces instead of buying the lows at my current level of exposure.
The VIX (which relates to SPX volatility) closed at 21.31 Friday vs. 14.82 the previous week. This is BEARISH for the SP500 Index, but rising to the 26ish level and then falling could ironically be Bullish short term. The Bulls must retake the 8-15 high of 16.86. The “Bull Nirvana Target” is our VIX # of the Year: 13.31. As I said last week, “Super Bull Nirvana would be VIX below 11.22, but I have the feeling it will take a while to get back there.”
The Bears need to take out the 26ish top that was tested this week for the market to go into another big decline. If they do it soon, it could last just a day or two.
Gold Signal YELLOW for a further U.S. stock market rally with a NEUTRAL Gold Trend.
Remember GLD is being used as an indicator for the ECONOMY here. I am calling it a NEUTRAL trend, because there is another higher low in now and a breakout above the recent trading range. It must hold above that red line discussed however.
Rate Signal BEARISH for a further stock market rally with a BULLISH 10 Year Yield Trend. Until the trend breaks down again, the current rate level can be seen as Bearish, in my opinion.
I said last week: “In fact, a legitimate Bullish signal would be rising rates with rising financials such as XLF and BAC as part of that. Minus that second part, you can forgetaboutit. The rate increase is NOT Bullish when the two don’t move up together. Big banks like global stability. Furthermore, high rates ARE normally good for banks, but NOT out of context. WHY NOT? Because this level of the 10 Year Treasury Yield, which is too high for current conditions as explained HERE, will eventually slow the economy.”
I’ll keep this here as a reminder from prior issues: The market seems to have adjusted to rates of up to 3% or so as said in the signal summary HERE” but NOT above there. Sept. 28th issue: “A rapid push higher in rates would mean trouble for stocks, as occurred in early 2018.”
Note: I’ve updated my criteria for the equity signal for a further U.S. stock market rally to the following: GREEN = Bullish, YELLOW = Neutral, RED = Bearish. In other words, the colors tell you whether the signal supports the stock rally or not, while the Bullish, Neutral, and Bearish designations are about the trend.
A BEARISH trend signal does not mean we should not buy. A BULLISH trend signal does not mean you cannot sell some exposure. It depends on what is going on in the economy and how oversold/overbought the market is at a given point whether the Bearish signal is to be sold, sold on the next bounce, etc. and whether a Bullish signal is to be bought or if profits should be taken. A NEUTRAL trend signal does not mean the end of the Bull or Bear. It means to wait and look for possible subsequent entry points within the existing trend, Bull or Bear, but preserve capital if the entry fails. Our strong intention is to buy low and sell high. By the way, I will keep showing the prior orange “Trigger lines” in the charts for now as reference points only; they have historical value for us from the post-2016 election period.
Thank you for reading. Would you please leave your comments below where it says “Leave a Reply”… or ask a question… Pay it forward too by sending the link to MarketTiming.Blog (that link will immediately connect them to this webpage) to a relative or friend. Thanks for doing that.
Be sure to visit the website for more general investing knowledge at:
Standard Disclaimer: It’s your money and your decision as to how to invest it.
I thank Worden Brothers for the charting system I use to post these charts. If you want to know more about the charting system I use every day, go to my “Other Resources” page here: Other Resources It makes it much easier to follow along with me if you can see the charts and manipulate them on your own computer. It’s a great investment to have an excellent charting system. Check it out with a free trial at the link above.
Finally: Please excuse and report all typos if you are so moved. I do my best to pick up most of them, but have not always found them all. Shoot me a comment (I don’t have to post your typo report as I filter them before publication, but I’ll be grateful to you!)
Copyright © 2018 By Wall Street Sun and Storm Report, LLC All rights reserved.
