A Market Timing Report based on the 10-05-2018 Close, published Saturday, October 6th, 2018…
I deliver focused comments on market timing once or twice a week. These are supplemented with daily “Tweets/StockTwits” (see links below).
1. SP500 Index Market Timing (S&P 500 Index®; SPY, SPX):
Last week I warned: “Cracks in the Bull thesis are showing up now. No big trend changes yet, but cracks, which could lead to more. The SP500 Index made a new high and then pulled back below the prior breakout.”
I also said last week: “My concern is that the small caps are flirting with significantly more danger now, by slicing through their lower channel line noted in purple on the 2nd chart below.”
As I also warned you, small caps were saying investors were seeing rising risk in owning small cap, higher beta and higher momentum stocks…and they came crashing down this week. The down trend in small caps was the clue I shared. They began selling off on 9-04-18. If you sold the breach of the purple line on the small cap stock chart on 9-24, you were ahead of the game.
The key to understanding “what is really going on” is interest rates. They have been ramping up since the August low, and this week the rise accelerated, and went past the prior May high of 3.115%.
I went over my concept of “#RateShock” in the 2-09-18 issue: HERE (see section 3 on gold). Rates are rising too fast for the current context of Ex-US slowing with extremely low rates still in both the EU and in Japan. In addition, China has devalued its currency to counteract #Trump’s #TradeWar impact. This means that this rise in U.S. rates is actually contractionary rather than accomodative in relative terms.
Now Chair Powell of the Fed openly says that rates should no longer remain “accomodative,” so this hawkishness has bond/Treasury investors all leaning to one side of the boat and there may have been some capitulation going on at the end of the week on the new breakout shown in the 4th chart below. That just pushes rates higher even faster.
My sense is this: If the rise in rates continues at the steep rate of the past few days, continuing to trend upward quickly, the stock market will head into a much more significant correction. Small caps have been hit the hardest, down about 6.48%, while the SP500 Index is down just 2.09% to Friday’s close off their highs, meaning small caps have fallen more than 3 times as far compared to the large cap decline off its top.
Now let’s check in on two “Canary Signals” we’ve been following:
“Intel-igent Market Timing Signal” (Intel; INTC): Negative. Even though INTC closed Friday at 47.03, which is above the reversal number, the stock hit the 200 day moving average and turned back down, which indicates, the bounce may be over. I said previously: “46.19 is now the reversal point to watch.” (Reminder: INTC is our “tell” on 2nd half earnings in tech as noted HERE. 47.42 was the second “checkpoint” we were following, and it has closed below that.
Bank of America (BAC) Market Timing Signal: Negative. Similarly BAC has failed to rise above both its 50 and 200 day moving averages, DESPITE the huge ramp in rates. The 10 minus 2 year spread in rates is still only 0.25 points vs. a spread of 0.23 on 9-27-18, so the spread has widened only a little despite the big move in the 10 year Treasury yield of 0.169.
Bank earnings are based on the spreads. The market was down 0.66% Friday (SPX), while BAC was down 0.55%. That difference is not enough to say the market is confident in the ability of banks to withstand this rapid increase in rates. The positive for the week for BAC? It was up for the week, while the SP500 Index was down.
The next logical target if rates don’t simmer down or earnings projections sour (big banks start reporting next Friday Oct. 12)? About a 6% fall for the SP500 Index to test the 200 day moving average. As many of you know, we never know how a stock or index will behave at a “level” like that until we get there, so stay connected on social media during the week….
Keep up-to-date during the week at Twitter and StockTwits (links below)…
Follow Me on Twitter® Follow Me on StockTwits®.
SP500 Large Cap Index (click chart to enlarge; SPX, SPY):

More downside ahead? Watch the 10 Year Treasury Yield.
Survey Says! Sentiment of individual investors (AAII.com) showed a Bull minus Bear percentage spread of +20.55% vs. +5.12% last week.
Sentiment peaked at about 20% at both the June 13th and August 29th near highs in the SP500 Index. The pullbacks were very shallow however, only 1.42% in August and only 3.63%. The catch? Interest rates were much lower at those times. Interesting that sentiment made this lower high RIGHT NEAR THE TOP. So that fits with the last high being somewhat significant in sentiment terms. Sentiment is no where near where it got at the Jan. 26th, 2018 high however.
The Big Bull market is not likely to die here, but that does not preclude a correction of 6% or even a Mini Bear market as I’ve coined the term HERE of up to a -25% drop. The impetus for the bigger fall that I call a Big Bear Market, a drop of up to 50% or even more is not clear unless it is simply rates ramping relentlessly toward 3.5% then 4% from here. That would do it, as it would induce a recession in my view. China tariffs ramping to 25% early next year could also do that as rates would be further pushed to the upside.
| AAII.Com Individual Investor Sentiment Poll | ||
| Bulls | Neutrals | Bears |
| 45.66% | 29.22% | 25.11% |
| Thurs. 12 am CT close to poll | ||
2. U.S. Small Caps Market Timing (IWM): Small caps could certainly bounce to a lower high, but I don’t believe the water is safe until the 10 Year Treasury Yield slows its rise and reverses.
Russell 2000 U.S. Small Cap Index (click chart to enlarge; IWM, RUT):

Small cap danger still as they do poorly when growth slows.
3. Gold Market Timing (GLD): Review the issues a few weeks back for an explanation for the abysmal performance of gold. REMEMBER THIS from my last Sept. issue: “As rates fall again, gold may perk up a bit, but the dollar could rally at the same time, blunting the gains from falling rates.” Gold will be tricky to trade, but will do best if a global panic occurs, say around Italy falling apart (its market already has fallen apart; the Italy ETF EWI is down 21.4% in its very own Bear market).
The Gold ETF (click chart to enlarge the chart; GLD):
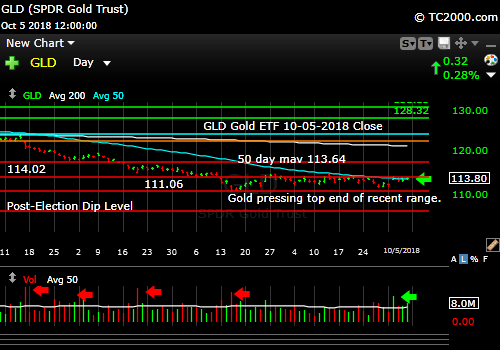
Gold is pressing the top end of the recent narrow range.
4. Interest Rate Market Timing – U.S. 10 Year Treasury Note Yield (TNX):
Rates are accelerating too fast as detailed above. This chart is a big key to following the stock market in the coming weeks.
Check out the “Market Signal Summary” below – after you review the following chart…
U.S. 10 Year Treasury Note Yield (click chart to enlarge; TNX, IEF, TYX,TLT,TBF):

Rates are rising too fast.
Now let’s review three key market timing signals together….
Do not use these signals as a trading plan. They are rough guidelines. I currently share my own moves on social media (links above).
MY MARKET SIGNAL AND TREND SUMMARY for a Further U.S. Stock Market Rally with Real GDP Growth (“real” means above inflation):
Stock Signal RED for a further U.S. stock market rally with a NEUTRAL SP500 Index trend.
The small caps broke down badly, so the SP500 Index could follow them down (as I said, about 6% from the high to start). The small caps are a better indicator of the health of the economy, as they are most vulnerable to economic changes, and hence, are the basis for this signal.
The VIX (which relates to SPX volatility) closed at 14.82 on Friday vs. 12.12 the previous week. This is BEARISH for the SP500 Index. Volatility spiked to 17.36 intraday, above the 8-15 high of 16.86, which is the Bear target to watch. The Bull target remains the same: our VIX # of the Year: 13.31. Super Bull Nirvana would be VIX below 11.22, but I have the feeling it will take a while to get back there.
Gold Signal GREEN for a further U.S. stock market rally with a BEARISH Gold Trend.
Remember GLD is being used as an indicator for the ECONOMY here. Scroll up and read the blurb above the gold chart please.
Rate Signal ?????? for a further stock market rally with a BULLISH 10 Year Yield Trend. Why the “??????”? It is because things have become more complicated with rates in an ACCELERATED break to new highs, and the financials turning down at week’s end.
In fact, a legitimate Bullish signal would be rising rates with rising financials such as XLF and BAC as part of that. Minus that second part, you can forgetaboutit. The rate increase is NOT Bullish when the two don’t move up together. Big banks like global stability. Furthermore, high rates ARE normally good for banks, but NOT out of context. WHY NOT? Because this level of the 10 Year Treasury Yield, which is too high for current conditions as explained HERE, will eventually slow the economy.
The market seems to have adjusted to rates of up to 3% or so as said in the signal summary HERE” but NOT above there. Sept. 28th issue: “A rapid push higher in rates would mean trouble for stocks, as occurred in early 2018.”
Welcome to #RateShock II.” Scary in RED isn’t it?
Note: I’ve updated my criteria for the equity signal for a further U.S. stock market rally to the following: GREEN = Bullish, YELLOW = Neutral, RED = Bearish. In other words, the colors tell you whether the signal supports the stock rally or not, while the Bullish, Neutral, and Bearish designations are about the trend.
NOTE: A BEARISH trend signal does not mean we should not buy. A BULLISH trend signal does not mean you cannot sell some exposure. It depends on what is going on in the economy and how oversold/overbought the market is at a given point whether the Bearish signal is to be sold, sold on the next bounce, etc. and whether a Bullish signal is to be bought or if profits should be taken. A NEUTRAL trend signal does not mean the end of the Bull or Bear. It means to wait and look for possible subsequent entry points within the existing trend, Bull or Bear, but preserve capital if the entry fails. Our strong intention is to buy low and sell high. By the way, I will keep showing the prior orange “Trigger lines” in the charts for now as reference points only; they have historical value for us from the post-2016 election period.
Thank you for reading. Would you please leave your comments below where it says “Leave a Reply”… or ask a question… Pay it forward too by sending the link to MarketTiming.Blog (that link will immediately connect them to this webpage) to a relative or friend. Thanks for doing that.
Be sure to visit the website for more general investing knowledge at:
Standard Disclaimer: It’s your money and your decision as to how to invest it.
I thank Worden Brothers for the charting system I use to post these charts. If you want to know more about the charting system I use every day, go to my “Other Resources” page here: Other Resources It makes it much easier to follow along with me if you can see the charts and manipulate them on your own computer. It’s a great investment to have an excellent charting system. Check it out with a free trial at the link above.
Finally: Please excuse and report all typos if you are so moved. I do my best to pick up most of them, but have not always found them all. Shoot me a comment (I don’t have to post your typo report as I filter them before publication, but I’ll be grateful to you!)
Copyright © 2018 By Wall Street Sun and Storm Report, LLC All rights reserved.
