A Market Timing Report based on the 11-16-2018 Close, published Saturday, November 17th, 2018…
I deliver focused comments on market timing once a week. These are supplemented with daily “Tweets/StockTwits” (see links below).
1. SP500 Index Market Timing (S&P 500 Index®; SPY, SPX):
To be sure of the short and the longer term market direction, we need to check in our “Must Not” List again this week. This will help you to keep oriented to the truly important issues in order to make wise investment decisions…
1. “The interest rate on the U.S. 10 Year Treasury (TNX) must not move over 3.248%. It especially cannot do that quickly, or we’ll see RateShockIII.”
This is no threat at the moment. Rates have been falling. The coincidence of massive corporate debt, massive deficits, inflation from tariffs, and inflation from rising wages at the end of the economic cycle could cause the economy to fall into stagflation vs. a deflationary slowdown.
The latter seems to be occurring in part due to an overeager Federal Reserve, which is raising short term interest rates into a global economic slowdown. Remember, it is not a slowing from positive to negative growth we are talking about; it is a slowing from more positive growth to less positive growth, a deceleration.
2. “Earnings and revenues cannot continue to deteriorate. The market must be able to see the reversal of this global slowdown coming to reverse the decline confidently. The test is to see analyst estimates of both E and Rev improving over time.”
Things could get worse. Slowing can lead to more slowing. It already has. China slowing has already fed through to Apple slowing as I predicted it would.
That’s the way slowing feeds through the global economy. China is slowing so their market goes down. Then the rich Chinese consumer feels the pinch of their portfolio being cut by 25-30% and does not buy the next Apple iPhone upgrade, because it’s just not something s/he has to have. Then Apple revenue and earnings go down, and the CFO tells us on the Apple earnings call that they will no longer report unit sales of iPhones. Then Apple stock falls quickly….
I predicted Apple’s stock would fall by seeing that this sequence would play out. People who own such stocks may become upset when they read my comments, because they are defending their positions, but isn’t it better to know the truth and be able to invest according to what is true rather than to hide from it? Isn’t it better to at the minimum take profits or reduce or eliminate your position before the news comes out?
How’s it going in the United States? The FactSet numbers on SP500 Earnings just one week later during the end of this earnings cycle are worse in earnings terms than they were just last week. Those sorts of downward revisions on top of downward revisions may continue.
3. “The President must not be impeached.”
Getting the answer on this will take a while…a long while. We know of no evidence of Trump “colluding” or otherwise breaking the law to date, but if Mueller ends up having serious accusations directly involving Trump, there will be trouble. (I covered the comparison to Clinton’s successful impeachment HERE.)
4. “The China Trade War must not be continued. It must be ended or the trajectory altered prior to 25% tariffs being imposed in January.”
The market clearly hopes the trade war should find a truce of some sort at the meeting between Trump and Xi during the G20 Summit of Nov.20-Dec. 1. How the Chinese would get a deal and not be forced to deal with intellectual property theft, state subsidized price competition, and one sided tariffs on American products is frankly incomprehensible.
I do not believe Trump will let them get away with it, which he must get credit for (despite what else you or I may think of him; I look at each thing he says and does separately. I look at the sum total only for an election. ).
The Chinese leadership is known for its stubbornness, not to mention President Xi has absolute power, so this could be a very drawn out process with the clear potential to cause further volatility in the stock market. It’s not among the core issues, but it effects some of the core issues in a non-trivial way.
The market has grown tired of “The Tweet that Cried Wolf,” followed by NEC Director Larry Kudlow emerging on the south lawn of the White House to refute any notion of trade war resolution being in sight. Trump will actually have to come to an agreement with Xi to give the market some real meat to chew on.
5. “Oil must not spike higher than 75ish, a prior high. Since oil is now in a Bear market, that is not a problem we face currently.”
Oil has crashed despite the most recent bounce to about $57, so this is not currently an issue.
6. A #Fed Focused must not myopically focus on inflation ONLY: I laid out one of the other central risks for the market last week, which many pundits have been discussing: “The Fed has a Congressional mandate to contain inflation as well as seek maximum employment. The latter goal has been accomplished in their view, so the whole game is controlling inflation now. That is the Fed’s ONLY job for now.” That’s what it thinks at least!
You see, the Fed does not need to stay below the current level of unemployment to meet its mandate. Five percent is the generally accepted level of “full employment,” so they think they can tighten monetary policy, even if it means some will have to lose their jobs.
Until the Fed sees inflation itself slow, they may not be willing to move to a more dovish position, despite what jobs may be lost. It’s an odd way to run a country isn’t it? The Federal Reserve allowed monetary policy to become too loose, and now everyone and their grandma says that they are making it too tight and are hurting the economy.
Getting back to the deterioration of earnings for U.S. companies…
Earnings projections have deteriorated a bit more since last week as further SP500 reports have come in. As I explained, the cycle cycles in on itself, so things can worsen before the turn comes without any other intervention. The latest FactSet PDF for the Nov. 16 earnings data will open directly HERE (link may only work for a week or so, so download it).
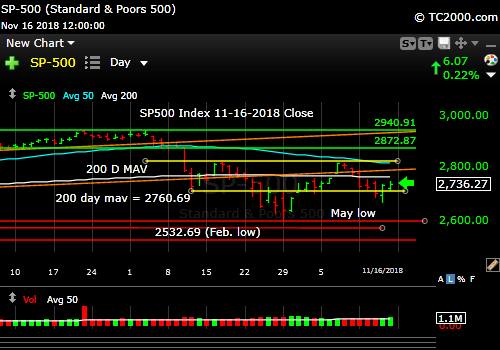
Last week I told you the market was unlikely to bounce straight up from the lower channel line of the 2017 upward channel for the SP500 Index (orange lines on the first chart below). I was right.
The SP500 Index fell to the prime target I suggested COULD hold, which was the October 11th low. Matching that low would as I said last week create a reverse head and shoulders formation, which is interpreted as Bullish by chartists who are looking for turning points.
In fact, on social media, I predicted they would start talking about this “reverse head and shoulders” possibility soon, and they did so the very next day on CNBC. What you read here, you will find will often appear on CNBC a day or two or even weeks to months later. That’s the purpose of my bothering to write. I write to discuss with you what is GOING to happen, not tell you just what is happening or what already happened. The latter two are very important, but not enough to get the bigger turns right.
So far, that technical level of the Oct. 11th low seems to be working, more or less. For the tech heavy QQQ, it’s working “less well” as the level is 167.81 and the close Fri. was 167.50. Close but no cigar! For small caps, “it’s close,” as the IWM level is 151.89 and the close was barely above there at 151.94.
For midcap IJH it is working as the level is 183.97, and the close was 186.20. For large cap SPY it is also working as the level is 270.36 and the close was 273.73. The VIX volatility index cooperated as well and closed at 18.14, below the 18.75 Bull target I set for the Bulls on Friday. (I share these numbers most days, although some of them carry over, so please record them when you see me tweet them.) There is more on the VIX numbers at the bottom section of this report, for those who follow them with me…
Now let’s check in on two “Canary Signals” we’ve been following:
“Intel-igent Market Timing Signal” (Intel; INTC): Negative. INTC is trying to break up out of the down channel, and has done so a bit, but must now move higher than three landmarks: the earlier Nov. high, the 200 day moving average (mav), and the Oct. high as well. It has moved above the 50 day mav, which is a start.
A recovery of Intel while Nvidia is in the midst of a temporary collapse may have less significance to the overall market, but it would still impress me. (Reminder: INTC was/is our “tell” on 2nd half earnings in tech as noted HERE. We are now well into the 4th quarter.)
Bank of America (BAC) Market Timing Signal: Negative. Keep an eye on 27.63 as a reversal number for BAC. Then breaking UP through the 50 day then 200 day mav’s obviously would be very positive should it happen. That likely will only happen if interest rates return to rising vs. falling. They’ve been falling since 11-09.
So what’s the upside target if this SP500 Index reverse head and shoulders formation works out? Typically a chartist would flip the rev. H&S formation up to the level of the reflection across the bases of the shoulders to guesstimate a target, which would mean a brand new all time high of 3029 for SP500 or 303ish for SPY, which is a rise of 10.7% from here.
That would imply a resumption of the Bull market, which seems unlikely in macroeconomic terms…
If we assume “It ain’t over,” meaning we are in a continuing “Correction” or a “Mini Bear Market” (my definitions are HERE) what COULD the SP500 Index Bounce Targets be?
- 200 day mav is at 2760.69 for SP500 Index: Not likely as a target, as it is too close to where we are (2736.27), just 0.89% higher.
- Lower 2017 channel line (orange line) at 2780: also a bit close at 1.60% higher.
- The down trend line between the 10-03 high and the 11-08 high at 2791 (not shown but it’s just the down trend line on the daily chart): 2.00% higher. Possible, though it would be very disappointing to the Bulls.
- The 50 day mav at 2812.69 (changes daily). 2.79% higher.
- The 10-17 high of 2816.94: 2.95% higher.
- The Jan. high of 2863.43: 4.65% higher.
- The All Time High (ATH) of 2940.91 on 9-21-18 (intraday): 7.48% higher.
My bet would be on exceeding the 50 day mav at a minimum (2.79%+). Rising above it sucks in more over eager Bulls, who begin to believe “Whew! It’s over now!” and so the rise usually overshoots the 50 day mav. I’d say the SP500 Index may fail between the 50 day mav and the January high for a gain of 2.79% to 4.65%.
WARNING: There are things I have wanted for Christmas I’ve never gotten, so this is not a “set it and forget it” process. 😉 (See how I’m starting to decorate the blog in GREEN and RED earlier and earlier in the year? lol)
Remember these levels are just levels, whether moving averages or head and shoulders or foot and mouth (there is no such thing ;))! They mean nothing out of context. What I observe AT the levels matters far more than the levels themselves, which is why keeping in touch via social media is so important, and here is where you do it…
Keep up-to-date during the week at Twitter and StockTwits (links below) where a combined 33,738 investors are following the markets with me…
Follow Me on Twitter® Follow Me on StockTwits®.
SP500 Large Cap Index (click chart to enlarge; SPX, SPY):
Finding support?
Survey Says! Sentiment of individual investors (AAII.com) showed a Bull minus Bear percentage spread of -0.87% vs. +10.09% the prior week. The poll closed the evening of the low close for the week. It’s amazing that sentiment did not deteriorate more than that. There’s not enough fear for a real bottom, but that does not dictate when that bottom may occur.
| AAII.Com Individual Investor Sentiment Poll | ||
| Bulls | Neutrals | Bears |
| 35.09% | 28.95% | 35.96% |
| Thurs. 12 am CT close to poll | ||
2. U.S. Small Caps Market Timing (IWM): Last week I said: “You can see that 151.89 target is an easy one to reach from here. IWM should hit that top red line on Monday in my view.” It did, and then overshot to the downside, but then recovered to just above my target, which is positive for a bounce.
And now we bounce or we don’t, but I’ve laid out the parameters for the large caps, and you can figure things out for yourself for the small caps. I am going to avoid them, because we are still in a global slowing period that won’t last just one quarter. If you play a bounce in them, you still sell them at the tops of the bounces, as close as you can get, in my view.
Russell 2000 U.S. Small Cap Index (click chart to enlarge; IWM, RUT):
NOTE: THE CHART IS FOR THE 11-16-18 CLOSE DESPITE THE LABEL

Small caps are above target for a bounce from this level.
3. Gold Market Timing (GLD): Rates are falling and gold is perking back up. If rates continue falling, gold will continue rallying as the dollar softens a bit as well. (There is more detail in prior issues.)
The Gold ETF (click chart to enlarge the chart; GLD):

Back up above the prior range of trading for another rally attempt.
4. Interest Rate Market Timing – U.S. 10 Year Treasury Note Yield (TNX):
Rates are falling but have a chance to bounce soon from the Oct. low due to “Risk On” positioning in the stock market, if this equity bounce continues.
Check out the “Market Signal Summary” below – after you review the following chart…
U.S. 10 Year Treasury Note Yield (click chart to enlarge; TNX, IEF, TYX, TLT, TBF):

Rates may bounce on a “Risk On” bounce.
Now let’s review three key market timing signals together….
Do not use these signals as a trading plan. They are rough guidelines. I currently share my own moves on social media (links above).
MY MARKET SIGNAL AND TREND SUMMARY for a Further U.S. Stock Market Rally with Real GDP Growth (“Real” means above inflation):
Stock Signal RED for a further U.S. stock market rally with a BEARISH SP500 Index trend. (The Signal here is based on the small caps, but I’m sure you can divine their trend is also Bearish!)
Despite the possibility of a bounce here, more healing (economic and technical) must occur before the market can shift back to Bullish. The VIX (which relates to SPX volatility) closed at 18.14 vs. 17.36 last week, so the Bulls have more work to do!
VIX Bull Targets: The Bulls must first get through (drop below) 17.24 and then retake the 8-15 high of 16.86. The next step would be taking back 16.09 to create a new recent daily low. The ‘Bull Nirvana Target’ is our VIX # of the Year: 13.31. As I said several weeks ago, ‘Super Bull Nirvana would be VIX below 11.22, but I have the feeling it will take a while to get back there.’
The Bears only got to 22.97 in this last upswing in volatility. Two weeks ago: “The Bears need to take out the 26ish top that was tested once again this week for the market to go into another leg of decline. If they do it soon, it COULD still just last a day or two.” As before, VIX 28.84 is the Bear target for Armageddon (another big chunk of losses driving SPX down to the May lows or worse).
Gold Signal RED for a further U.S. stock market rally with a BULLISH Gold Trend. Tentatively Bullish that is, as rates must cooperate by moving still lower below the Oct. TNX low.
From before: “Remember GLD is being used as an indicator for the ECONOMY here.”
Rate Signal RED for a further stock market rally with a BEARISH 10 Year Yield Trend.
As said: “The up trend is still broken until the lower high is exceeded All heck would break loose for equities if TNX lurches above 3.248%, particularly if the rise is rapid. You buy long dated Treasuries as close as you can to 3.248% (IEF, TLT, etc.).” At this point, I will likely wait for a bounce in rates.
I’m leaving this important statement here until things change: “This level of the 10 Year Treasury Yield, which is too high for current conditions as explained HERE, will eventually slow the economy.”
Sept. 28th issue: “A rapid push higher in rates would mean trouble for stocks, as occurred in early 2018.” That’s what I call “Rate Shock.” This period of rising rates is #RateShockII.”
Thank you for reading. Would you please leave your comments below where it says “Leave a Reply”… or ask a question or report a typo… Pay it forward too by sending the link to MarketTiming.Blog (that link will immediately connect them to this webpage) to a relative or friend. Thanks for doing that.
Be sure to visit the website for more general investing knowledge at:
Standard Disclaimer: It’s your money and your decision as to how to invest it.
I thank Worden Brothers for the charting system I use to post these charts. If you want to know more about the charting system I use every day, go HERE. It makes it much easier to follow along with me if you can see the charts and manipulate them on your own computer. It’s a great investment to have an excellent charting system. Check it out with a free trial at the link above. I am an affiliate of Worden Brothers, though oddly I’ve never been paid a cent by them. If you HAVE subscribed to their service, please send me a message. 😉
Finally: Please excuse and REPORT all typos if you are so moved. I do my best to pick up most of them, but have not always found them all. Shoot me a typo report HERE.
Note: I’ve updated my criteria for the equity signal for a further U.S. stock market rally to the following: GREEN = Bullish, YELLOW = Neutral, RED = Bearish. In other words, the colors tell you whether the signal supports the stock rally or not, while the Bullish, Neutral, and Bearish designations are about the trend.
A BEARISH trend signal does not mean we should not buy. A BULLISH trend signal does not mean you cannot sell some exposure. It depends on what is going on in the economy and how oversold/overbought the market is at a given point whether the Bearish signal is to be sold, sold on the next bounce, etc. and whether a Bullish signal is to be bought or if profits should be taken. A NEUTRAL trend signal does not mean the end of the Bull or Bear. It means to wait and look for possible subsequent entry points within the existing trend, Bull or Bear, but preserve capital if the entry fails. Our strong intention is to buy low and sell high. By the way, I will keep showing the prior orange “Trigger lines” in the charts for now as reference points only; they have historical value for us from the post-2016 election period.
Copyright © 2018 By Wall Street Sun and Storm Report, LLC All rights reserved.

I will be focusing on the various levels in the report! I like data along with charting those levels to help with entry/exit points. As I said last week, I believe we go to SPX 2600 level before any bounce and talk of impeachment will cause further downside in the markets, I’ll stay with Passive Shorting, I currently have a 60% investable cash position! Great work and thanks.
You’re welcome Charles. You likely meant bounce to 2600 level? That’s my first target. More in today’s issue.
Good morning and as always thank you!
You are very welcome Charles!