A Market Timing Report based on the 01-25-2019 Close, published Sunday, January 27th, 2019…
I deliver focused comments on market timing once a week. These are supplemented with daily “Tweets/StockTwits” (see links below) and comments in the “markettiming” room on StockTwits.
1. SP500 Index Market Timing (S&P 500 Index®; SPY, SPX):
In the past week the shutdown was shut down and Commerce Secretary Wilbur Ross (who routinely appears barely able to speak) threw cold water on a quick China Trade War resolution. Finally, Roger Stone was indicted in typical Justice Dept. style replete with heavy assault weapons and an overflying helicopter, supposedly to stop him from fleeing with an expired passport. Where is the ACLU when you need them? There is still no evidence of President Trump being involved in the Clinton Campaign infiltration by Russia.
As said last week and this still holds as the most important perspective on what really matters: “The market has also been rising despite the fact that the next three quarters along with the Q4 quarter (sub-optimal), will show further economic slowing. Analysts will likely further cut estimates in the coming months, which would pressure stock prices.”
The market failed to rise higher than the high of Friday Jan. 18th, which remains the next Bull goal. The updated VIX goals are noted at the bottom of this report for those who are interested. Hint: You should be interested, because attempting to trade high volatility can be injurious to your capital if you are leaning the wrong way.
The market is at an important pivot point. As I explained last week in detail, rising to the 200 day moving average or just above it to suck in more stock market chasers is not impossible, but the odds are similar in my view that the market has already seen another significant lower high and will move down to test the prior low or lower.
Now let’s check in on two “Canary Signals” we’ve been following:
“Intel-igent Market Timing Signal” (Intel; INTC): Much weaker after earnings induced a 7+% drop that ended at -5.47% at the close. Last week I said: “Now re-topping near the 200 day moving average – still. Intel is not out of the woods yet!”
Most importantly, the Intel Interim CEO Bob Swan said he was still concerned about slowing of the global economy. Some chip companies are doing well still like Xilinx, which shot up last week, but Intel is a bellwether that says not all is well in the world’s economy.
The Bull Goalpost remains: “A rise above 50.60 would change the current picture of a down trend since the June high.”
Bank of America (BAC) Market Timing Signal: The company reported earnings and rose further above the 200 day moving average. This is positive, and it could return to the down trend currently at about 30.16ish and then fail based on falling interest rates.
Protect your existing profits though as said last week: “BUT read my note on rates below, because if interest rates don’t move higher and instead fall as the market was expecting just days ago, BAC and the financial sector ETF XLF will not likely behave well.”
Keep up-to-date during the week at Twitter and StockTwits (links below) where a combined 33,829 investors are following the markets with me…
Follow Me on Twitter® Follow Me on StockTwits®.
Join the Conversation in the StockTwits “markettiming” Room
SP500 Large Cap Index (click chart to enlarge; SPX, SPY): OBVIOUSLY it was a 2019 close!
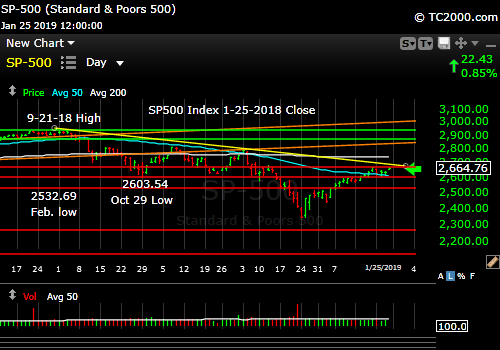
Pivot up or pivot down, that is the question…
Survey Says! Sentiment of individual investors (AAII.com) showed a Bull minus Bear percentage spread of +5.34% vs. -2.72% last week. Same conclusion as last week: “The market has been up strongly since the Dec. 24th low, and at a top, we’d expect more Bulls to show up. That says to me, we are not yet at a “toppy” sentiment level. Sentiment was in the high 20’s during the mid-bounce period off the 2014 SP500 Index low. We are not even close now.”
| Bulls | Neutrals | Bears |
| 37.66% | 30.03% | 32.32% |
| Thurs. 12 am CT close to poll | ||
2. U.S. Small Caps Market Timing (IWM): Small caps are in the same pivot position as large caps, but above the down trend line From last week: “I would still warn that during periods of economic uncertainty, small cap stocks are NOT where you want to be, unless you are trading them on a short leash. The December 3rd high followed by the 200 day moving average are the next obvious targets for the small caps.”
Russell 2000 U.S. Small Cap Index (click chart to enlarge; IWM, RUT):

Pivot for small caps too…
3. Gold Market Timing (GLD): Three weeks ago I said: “A trading add on pullbacks.” I also said last week “If rates turn down from here (not clear yet), gold should start responding as the U.S. dollar weakens, unless the rest of the world turns south. Then the USD is a place of refuge and that works against gold prices.”
Last week as well: “Note that the pullback in gold is only to the fairly steep up trend thus far… The trend is still intact in other words.”
I bought GDX gold miners as a proxy for gold on the pullback and they were up last week. The trend is up, and a gold trading position should pay off if rates fall from here.
The Gold ETF (click chart to enlarge the chart; GLD):
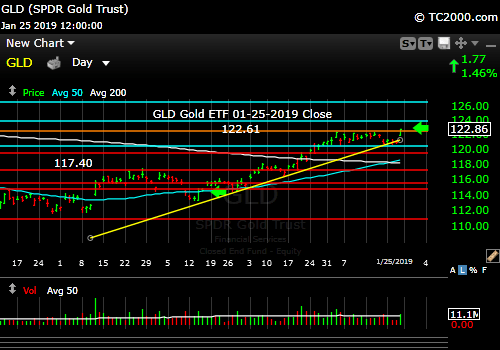
The gold trend is up.
4. Interest Rate Market Timing – U.S. 10 Year Treasury Note Yield (TNX):
Last week: “A move above 2.808% will add another nail to the ‘interest rates are falling because the Fed is going dovish’ scenario coffin.”
I made the point: “This is a dumb market that makes up nonsense about the Fed as it sees fit and then ignores what interest rates do the following week. Which narrative are we going with this week people???
Look for oil prices to ease, or inflation will in fact start to pick up again.
By the way, stagflation is great for gold prices!”
I claimed last week “2.808% should stop this rally,” and and it did this week. Keep an eye on that number. A fall from there would indicate the “back to business notion” is a false one, and a retest of the stock market lows is on its way.
Check out the “Market Signal Summary” below – after you review the following chart…
U.S. 10 Year Treasury Note Yield (click chart to enlarge; TNX, IEF, TYX, TLT, TBF):

Rates stopped rising at 2.808%.
Now let’s review three key market timing signals together….
Do not use these signals as a trading plan. They are rough guidelines. I currently share my own moves on social media (links above).
MY MARKET SIGNAL AND TREND SUMMARY for a Further U.S. Stock Market Rally with Real GDP Growth (“Real” means above inflation):
Stock Signal NEUTRAL for a further U.S. stock market rally with a NEUTRAL SP500 Index trend. (signal here is based on small caps) The small caps are now back above the down trend line, while SPX is above the Feb. and Oct. lows, both positive, while still being below the recent down trend line.
The V*IX (which relates to SPX volatility) closed at 17.42 vs. 17.80 last week. I’m still not impressed there by the Bulls effort!
From prior week and other back issues: Further V*IX Bull Targets: 17.35, then a move below 17.06, 16.09, and 15.95 to create a new recent low. The ‘Bull Nirvana Target’ is our V*IX # of 2018: 13.31.”
NOTE: 17.98 is the immediate Bear target.
The VIX Up Trend Line is at 20.01ish and a rise above there would be the next Bear target.
Gold Signal RED for a further U.S. stock market rally with a BULLISH Gold Trend. A further GLD rally will be subject to interest rates, which will impact the U.S. dollar as explained above. Note that the pullback in gold is only to the up trend thus far.
From before: “Remember GLD is being used as an indicator for the ECONOMY here.”
Rate Signal NEUTRAL for a further stock market rally with a NEUTRAL 10 Year Yield Trend. I said weeks ago, “Watch the oil price too. Higher oil tends to mean higher rates.” Oil is in fact bouncing with rates, but has reached a level it could pull back from.
As for much higher rates and their possible impact, I said previously: “All heck would break loose for equities if TNX lurches above 3.248%, particularly if the rise is rapid. Buy long dated Treasuries as close as you can to 3.248% on the 10 Year Yield TNX (IEF, TLT, etc.).”
I previously warned about the Fed tightening process: “This level of the 10 Year Treasury Yield, which is too high for current conditions as explained HERE, will eventually slow the economy.” 2.621% was the peak back in 2017 when stocks did best. Anything below that would be an improvement.
Sept. 28th issue: “A rapid push higher in rates would mean trouble for stocks, as occurred in early 2018. That’s what I call ‘Rate Shock.'” The period of rising rates in early October was #RateShockII as I called it.
Thank you for reading. Would you please leave your comments below where it says “Leave a Reply”… or ask a question or report a typo…
Pay it forward by sending the link to MarketTiming.Blog (that link will immediately connect them to this webpage) to a relative or friend. Thanks for doing that.
Be sure to visit the website for more general investing knowledge at:
Standard Disclaimer: It’s your money and your decision as to how to invest it.
I thank Worden Brothers for the charting system I use to post these charts. If you want to know more about the charting system I use every day, go HERE. It makes it much easier to follow along with me if you can see the charts and manipulate them on your own computer. It’s a great investment to have an excellent charting system. Check it out with a free trial at the link above. I am an affiliate of Worden Brothers, though oddly I’ve never been paid a cent by them. If you HAVE subscribed to their service, please send me a message. 😉
Note: I’ve updated my criteria for the equity signal for a further U.S. stock market rally to the following: GREEN = Bullish, YELLOW = Neutral, RED = Bearish. In other words, the colors tell you whether the signal supports the stock rally or not, while the Bullish, Neutral, and Bearish designations are about the trend.
A BEARISH trend signal does not mean we should not buy. A BULLISH trend signal does not mean you cannot sell some exposure. It depends on what is going on in the economy and how oversold/overbought the market is at a given point whether the Bearish signal is to be sold, sold on the next bounce, etc. and whether a Bullish signal is to be bought or if profits should be taken. A NEUTRAL trend signal does not mean the end of the Bull or Bear. It means to wait and look for possible subsequent entry points within the existing trend, Bull or Bear, but preserve capital if the entry fails. Our strong intention is to buy low and sell high. By the way, I will keep showing the prior orange “Trigger lines” in the charts for now as reference points only; they have historical value for us from the post-2016 election period.
Copyright © 2019 By Wall Street Sun and Storm Report, LLC All rights reserved.
