A Market Timing Report based on the 02-01-2019 Close, published Saturday, February 2nd, 2019…
I deliver focused comments on market timing once a week. These are supplemented with daily “Tweets/StockTwits” (see links below) and comments in the “markettiming” room on StockTwits.
1. SP500 Index Market Timing (S&P 500 Index®; SPY, SPX):
The Risks That Have Gone Away Per the Market:
1. The Fed. Chair Powell is now the self-declared lapdog for Trump. He’ll keep rates low. He may not ease, but he won’t hike, because too many people hate him when he’s too hawkish as he was in late 2018. But if inflation rises significantly above their 2% PCE Index number, he’ll have to hike to fulfill the Federal Reserve’s mandate.
2. A China Trade Deal is a done deal, because both sides need it to be. China cannot move into the 21st Century without respecting tech patents and the like. They want protection for their big AI effort for ex. A deal will be done in February and victory will be claimed no matter what Trump gets.
3. No news on Trump colluding. The market is ASSUMING Mueller has nothing on him specifically, and he’ll pardon his son. The market could care less about the people around Trump including Ivanka and Don, Jr. It cares whether Trump lied/got his hands dirty. No evidence of that yet. No impeachment…yet.
NOT GOING AWAY …
Economic Slowing, though not for all companies: Things are worse per Intel’s new permanent bean counting CEO Bob Swan. (I have nothing against him, as he seems like a decent guy, but I’m for tech savvy leadership of tech companies, not financial whizzes. That’s what made Intel great as explained HERE: MarketWatch.)
Microsoft had a poor response from the market to their guidance as did Amazon, which expects to spend more money trying to be more like Walmart and taking over the rest of the free world (Russia and China won’t let them play there). Here’s the thing and you can quote me on this: Amazon is trying to be more like Walmart, while Walmart is trying to be more like Amazon. When they converge, Amazon will be valued as Walmart is: A LOT LOWER perhaps with Walmart’s valuation significantly higher. Perhaps…
There were exceptions to “weak earnings,” which means stock picking now matters once again. Netflix did well and the stock is back in an uptrend though challenged around the 200 day moving average (mav) so watch what it does from there. AMD just broke out to the upside with their success with 7 nm chip tech vs. Intel’s slow leap to 10 nm chip tech. Xilinx is at a new all time high on their great success. I spotted that one weeks ago, but hesitated because of the sector issues around global slowing. That was a mistake. Some stories break through the macro picture and drive stock prices up. I shared that strategic point after the early Feb. decline as longer term readers recall.
OKTA is another company that is breaking to new highs with earnings out in March. It’s a cloud based identity security company that serves massive corporations. A buyout target too perhaps.
What does the future hold according to analysts and FactSet’s data for 2019 Earnings and Revenue Growth?
Read the details HERE, but this is the summary: FactSet said earnings and revenues grew 20.2% and 8.7%, respectively in 2018, but those numbers will fall to 5.6% and 5.3% for 2019. That’s a huge drop. And earnings are due to be negative vs. the same quarter of 2018 for Q1, which we are now in.
“For Q1 2019, analysts are projecting a decline in earnings (-0.8%) and revenue growth of 5.7%.
For Q2 2019, analysts are projecting earnings growth of 1.6% and revenue growth of 5.1%.
For Q3 2019, analysts are projecting earnings growth of 2.7% and revenue growth of 4.9%.
For Q4 2019, analysts are projecting earnings growth of 9.9% and revenue growth of 6.0%.”
You can see from the above, the market may be assuming recovery of both earnings and revenue growth into Q4, and as it discounts the future 6 months out or so, it’s rallying a bit ahead of schedule. But what if the slowdown continues to drag the U.S. lower? Then Q2-Q4 may simply be revised lower. That’s the risk inherent in this bounce in the U.S. stock market.
Meanwhile the market has been rising, frustrating the Bears and economic doubters (it does not mean they are wrong, but I’ll tell you what the technical breaking point is now for me…) We all have heard bounces in Bear markets can be huge only to have the Bear resume, but when does one go with the trend? Answer: When the trend changes in a significant way.
Last week I said, “The market failed to rise higher than the high of Friday Jan. 18th, which remains the next Bull goal.” This week we are just above the Jan. 18th high and just below the 200 day moving average (mav) of the SP500 Index.
Last week: “The market is at an important pivot point. As I explained last week in detail, rising to the 200 day moving average or just above it to suck in more stock market chasers is not impossible, but the odds are similar in my view that the market has already seen another significant lower high and will move down to test the prior low or lower.”
The SP500 Index is now at an even more obvious decision point, although not quite there yet. If it moves over the 200 day moving average, a new count starts for the Bulls.
What do I mean by that? There is data which was reviewed in Feb. of last year by writer and editor Ben Morris at Stansberry Research’s Daily Wealth Trader showing that when the 200 day moving average (mav), that is the moving average ITSELF, not the price of the index, falls for one full month (which he did not define precisely; I assume calendar month of 30 days) it gives a distinct sell signal that allows investors to avoid significant further downside.
No signal is 100% effective, and there were only 9 data points (sells followed by re-entry buys). The signal is a bit too slow in my view. Thirty days is a long time. The thing is, it has worked over the past 35+ years.
The data Ben reviewed shows that over 35 years, the gains in using this system would have yielded 2,104% with the 200 day mav buy-and-sell strategy vs. a 1,831% gain – 272 percentage points less with “Buy and Hold.” (the study end point was 2-21-18)
What do you miss by being out of the market between the sells and the re-entries? In 1990, you missed a 16.9% gain prior to re-entry due to the signal’s built in delay. Those who read these posts carefully will remember there was a shallow recession in 1990, from which we recovered. The market was down in 1990 by almost the exact same amount (around 20%). You would have bought the market back a somewhat late is the point. And in 2011, you would have exited in late Nov. and would have bought on the Bull signal in early April 2o12 (so much for “go away in May”) missing a 17% gain between exit and re-entry.
On the other hand, you would have avoided a 32.5% loss from Nov. 2000 to re-entry in May 2003 and a further 26.1% loss from Feb. 2008 to August 2009 when you would have re-entered the market. There were only NINE sell signals over those 35+ years, so this does not involve a lot of trading for users of this strategy.
On the side of “why not just still buy and hold,” Ben found that despite mostly missing single digit gains and the two roughly 17% gains and the two huge losses cited above, the average gain was 0.1% for the 9 signals. The average gain does not tell the whole story though…
Remember the net result was 272% MORE in gains using these signals. In addition, the time out of stocks would have been 7.5 years Ben says, which frees up the money to invest in things like gold (which I did successfully, doubling my gold position when it was at about $380 per ounce), now at $1317.10. ( I took out my entire principle a few years ago at 1370/oz. I’m riding the gravy and have added GDX exposure more recently.)
If you like this sort of trading strategy and want to subscribe, send me a message through the Contact tab above, and I’ll do my best to connect you to a discounted subscription (meaning I should be able to do this if enough of you respond and make it worth their while (Ben, the author and Porter, the founder of S&A); full disclosure: I may be able to negotiate a discount for you, and if so could potentially receive compensation from S&A).
TWO CHOICES: Buy as the Market Rises or Simply Start Buying Monday vs. Wait for the Slow Signal (Buy or Wait)
What could you do at this point to take advantage of the above data? Only if you are willing to trade your new exposure to stocks should you buy at this level in my view.
The data says there is no “Buy Signal” yet. If you are going to follow the above signal, you don’t buy until the price is above the 200 day mav for one entire month. It has not yet spent that first day above it with the market up 15.3% from the Dec. 26th intraday low.
If you are willing to trade out of it, then you could place your first of several buys on the first daily close back above the 200 day moving average and set a tight stop of 1-3 percent at most (or you could buy some on the open on Monday as your first buy). In other words, you’ll sell if the price goes back below the 200 day mav AND is down 1-3% from your buy point on a close (you could use an intraday signal, but volatile markets can fake you out).
Why would this make sense, even from this elevated level? First, you are going to average into the market. You could even add smaller amounts higher and weight your earlier buys more as in 3, 2, 1, meaning your total purchase is the sum of those or 6 units of buying. The SP500 Index upside from the 200 day mav is 7.27% to the prior all time high. You could buy on the first close above the 200 day moving average or buy half of that intraday as it crosses the line. Your choice.
Let’s now consider the stops to use for each buy. Since the max gain to the all time high (ATH) is limited and becomes more limited with each buy, I would set each stop at 1/2 to 1/3 of the potential gain for each of your buys. A 2-3 fold Reward:Risk ratio is usually considered acceptable to traders. That means if the gains to the prior high are:
6% – use a 2-3% stop (1/3 to 1/2) from that buy price
4% – use a 1.33-2.0% stop(1/3 to 1/2) from that buy price….and so on.
You can see there is not that much room between “here” and “there” in this trade set-up, so you may need to add in just two stages, in a 4:2 proportion for a total of 6 buying units. Buy 1 = 4 units. Buy 2 = 2 units. (If buying $6000 of SPY for ex., you’d buy 4K then 2K.) You can follow me via the social media links below to see what I do. Depending on the market set-up, I may add Mon. am and use that 2-3% stop. My second add may then be a close above the 200 day mav. Then, we’ll see.
UPDATE 10:16 am 2-05-2019:
Here is why the 200 day Moving Avcrage Tripwire May Trip You Up
SPY is up through that 271.20 high from Fri and VIX has broken down through all the key targets I set for the Bulls. The VIX is now sliding down the lower Bollinger Band rather than bouncing from it. The trend continues UP for the market with the 200 D mav facing it SPY at 273.91 and the SPX 200 D at 2741.75. SPX is now at 2733.60 as I type this. SPY is at 272.86. We’re close to a decision point.
Here’s the problem with doing what I suggested as a possible trading strategy this past weekend on the blog – the last three swings up above the 200 day mav were on 10-16, 11-07, and 11-30, and they all occurred on gaps up, at which point, you would have bought the top of the swings! My suggestion to buy earlier and then set a stop as the SP500 rose above the 200 day mav would work better if you want to trade such a move, and now it’s too late for that. Just waiting for the slower signal or the next major pullback may be the best choice at this particular level of the market.
As I continue to type this VIX is back to green for the day at 15.35. Perhaps at this point in the run, it’s better to be patient unless there are specific stock stories that fit your bill.
Back to Saturday’s brief….
Remember, my favored scenario on the basis of economic data is that this is still a bounce in a Bear market. Favored does not mean I’m stuck on one scenario. The world is far too complex to be stuck believing one thing. However, if the U.S. economy follows the rest of the world down (China and Europe both continued to slow this week as our market was rising), you will most likely be taking small losses on the above entry points. Keep that in mind. If the economic data continues to improve in the U.S. as the PMI and ISM Manufacturing numbers did this week, with the PMI continuing to rise and exceeding the October high, the SP500 will continue back to the prior high and even higher.
One Last Thing…
There is one last thing I will likely insist upon before adding exposure at these levels, which is a fall of the VIX through the last two immediate Bull targets of 16.09 and 15.94 (one source says that 2nd # is 15.95). I explain this viewpoint HERE.
IN CONCLUSION:
- You could stick with the slower 200 day mav signal and wait for a re-entry signal.
- You could enter in stages on a move above the 200 day moving average (after that VIX break through both numbers noted above), or simply buy on Monday if you prefer with stops in mind should the market head back down as I am expecting it will, based on the negative data to be reported for at least 3 quarters including Q1 data to be reported in April, 2019. If the market is already looking past that mess, I’m wrong.
Now let’s check in on two “Canary Signals” we’ve been following:
“Intel-igent Market Timing Signal” (Intel; INTC): Neutral. The stock has been in a long consolidation, but bounced on the news that Bob Swan, bean counter in chief was made permanent CEO (see above link on that).
Remember this from last week: “Most importantly, the Intel Interim CEO Bob Swan said he was still concerned about slowing of the global economy. Some chip companies are doing well still like Xilinx, which shot up last week, but Intel is a bellwether that says not all is well in the world’s economy.”
I’ll sticking with this: The Bull Goalpost remains: “A rise above 50.60 would change the current picture of a down trend since the June high.” Consider buying the stock on a close above there or a move through there depending on what the market looks like if you like Intel as an investment. I am using it here as a technical signal.
Bank of America (BAC) Market Timing Signal: Negative. The company reported earnings and rose further above the 200 day moving average and has now fallen back below that line.
Two weeks ago: “BUT read my note on rates below, because if interest rates don’t move higher [they didn’t; they fell on a dovish Powell] and instead fall as the market was expecting just days ago, BAC and the financial sector ETF XLF will not likely behave well.”
BAC was down even on the rate bounce on Friday. Negative.
Keep up-to-date during the week at Twitter and StockTwits (links below) where a combined 33,829 investors are following the markets with me…
Follow Me on Twitter® Follow Me on StockTwits®.
Join the Conversation in the StockTwits “markettiming” Room
SP500 Large Cap Index (click chart to enlarge; SPX, SPY):
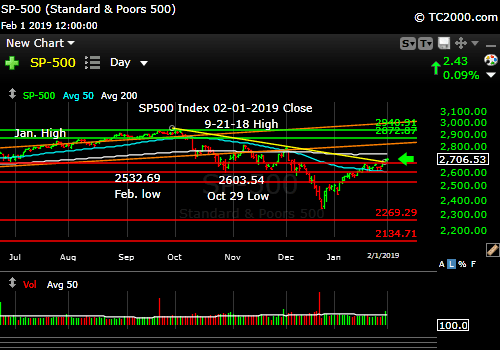
Headed toward a wall at the 200 day moving average or nirvana?
Survey Says! Sentiment of individual investors (AAII.com) showed a Bull minus Bear percentage spread of +0.00% this week vs. +5.34% last week. I’ve never seen +0.00% before.
Same conclusion as the past two weeks: “The market has been up strongly since the Dec. 24th low, and at a top, we’d expect more Bulls to show up. That says to me, we are not yet at a “toppy” sentiment level. Sentiment was in the high 20’s during the mid-bounce period off the 2014 SP500 Index low. We are not even close now.”
| Bulls | Neutrals | Bears |
| 31.76% | 36.49% | 31.76% |
| Thurs. 12 am CT close to poll | ||
2. U.S. Small Caps Market Timing (IWM): As before: “The December 3rd high followed by the 200 day moving average are the next obvious targets for the small caps.” Once above the Dec. 3rd high (154.48), the Bulls will have the ball back. Still, beware of another leg down as discussed above in depth. In a slowing economy, small caps are on average more vulnerable.
Russell 2000 U.S. Small Cap Index (click chart to enlarge; IWM, RUT):
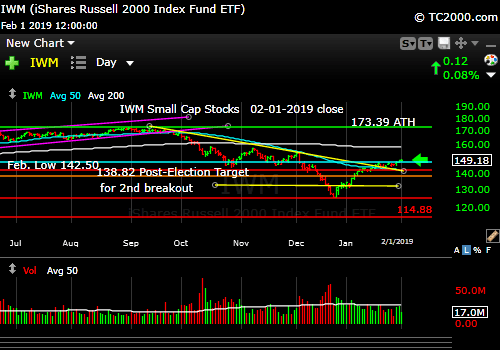
Still rising yet farther from “recovery” however.
3. Gold Market Timing (GLD): Four weeks ago I said: “A trading add on pullbacks.” I also said two weeks ago, “If rates turn down from here (not clear yet), gold should start responding as the U.S. dollar weakens, unless the rest of the world turns south. Then the USD is a place of refuge and that works against gold prices.”
I bought more GDX gold miners as a proxy for gold on the pullback Friday and they were up from my buy into the close. I am concerned about the rise in the 10 Year Yield on Friday that occurred on improving economic data and strong employment and wage numbers. These are late cycle phenomena, but we need to pay attention to any signs of U.S. recovery. Gold does NOT do well in dollar terms when the U.S. economy is strengthening, because the dollar rises as rates rise and the Fed tightens. But the Fed has gone “dovish” right? 😉
The Gold ETF (click chart to enlarge the chart; GLD): Look at the strength of the Gold Trend!

Gold still in uptrend. I’m buying the dips.
4. Interest Rate Market Timing – U.S. 10 Year Treasury Note Yield (TNX):
Two weeks ago: “A move above 2.808% will add another nail to the ‘interest rates are falling because the Fed is going dovish’ scenario coffin.”
I also made the point two weeks ago: “This is a dumb market that makes up nonsense about the Fed as it sees fit and then ignores what interest rates do the following week. Which narrative are we going with this week people???”
The market cannot have it both ways. The market supposedly liked Powell’s dovishness, because it believes the economy is slowing. It also supposedly believes the economy is strengthening based on strong employment, strong wages, and a rise of PMI from the December low (it must rise above the Oct. high to matter as said this week), which is presumably why rates ROSE on Friday. You get my point? If lower rates = “Good” then higher rates are NOT “Good.”
Check out the “Market Signal Summary” below – after you review the following chart…
U.S. 10 Year Treasury Note Yield (click chart to enlarge; TNX, IEF, TYX, TLT, TBF): Note the bounce up off the down trend line!

Dovish Fed or economic recovery? Take your pick!
Now let’s review three key market timing signals together….
Do not use these signals as a trading plan. They are rough guidelines. I currently share my own moves on social media (links above).
MY MARKET SIGNAL AND TREND SUMMARY for a Further U.S. Stock Market Rally with Real GDP Growth (“Real” means above inflation):
Stock Signal NEUTRAL for a further U.S. stock market rally with a NEUTRAL SP500 Index trend. (signal here is based on small caps) The small caps are now back above the down trend line, and the SPX is above the Feb. and Oct. lows, both positive, and is also now above the recent down trend line. I will call the trend Bullish when small caps rise above the Dec. 3rd high.
The V*IX (which relates to SPX volatility) closed at 16.14 vs. 17.42 last week. The Bulls have made progress, but are at a crossroads as discussed HERE. It crossed 3 targets to get there: 17.06, 17.35 and 17.98. All these are now Bear targets.
Further V*IX Bull Targets: 16.09, and 15.95 to create a new recent low. The ‘Bull Nirvana Target’ is our V*IX # of 2018: 13.31.”
The VIX Up Trend Line is at 21.27ish.
Gold Signal RED for a further U.S. stock market rally with a BULLISH Gold Trend. A further GLD rally will be subject to interest rates, which will impact the U.S. dollar as explained above. I added exposure this week.
From before: “Remember GLD is being used as an indicator for the ECONOMY here.”
Rate Signal NEUTRAL for a further stock market rally with a NEUTRAL 10 Year Yield Trend. Despite the jump on Friday, which is almost what is referred to as a Bullish engulfing signal, rates came down after Powell went chicken-dovish. I’d call it a consolidation off a low, which is NEUTRAL.
I said weeks ago, “Watch the oil price too. Higher oil tends to mean higher rates.” Oil is in fact bouncing with rates, but has reached a level it could pull back from.
As for much higher rates and their possible impact, I said previously: “All heck would break loose for equities if TNX lurches above 3.248%, particularly if the rise is rapid. Buy long dated Treasuries as close as you can to 3.248% on the 10 Year Yield TNX (IEF, TLT, etc.).”
I previously warned about the Fed tightening process: “This level of the 10 Year Treasury Yield, which is too high for current conditions as explained HERE, will eventually slow the economy.” 2.621% was the peak back in 2017 when stocks did best. Anything below that would be an improvement.
Sept. 28th issue: “A rapid push higher in rates would mean trouble for stocks, as occurred in early 2018. That’s what I call ‘Rate Shock.'” The period of rising rates in early October was #RateShockII as I called it.
Thank you for reading. Would you please leave your comments below where it says “Leave a Reply”… or ask a question or report a typo…
Pay it forward by sending the link to MarketTiming.Blog (that link will immediately connect them to this webpage) to a relative or friend. Thanks for doing that.
Be sure to visit the website for more general investing knowledge at:
Standard Disclaimer: It’s your money and your decision as to how to invest it.
I thank Worden Brothers for the charting system I use to post these charts. If you want to know more about the charting system I use every day, go HERE. It makes it much easier to follow along with me if you can see the charts and manipulate them on your own computer. It’s a great investment to have an excellent charting system. Check it out with a free trial at the link above. I am an affiliate of Worden Brothers, though oddly I’ve never been paid a cent by them. If you HAVE subscribed to their service, please send me a message. 😉
Note: I’ve updated my criteria for the equity signal for a further U.S. stock market rally to the following: GREEN = Bullish, YELLOW = Neutral, RED = Bearish. In other words, the colors tell you whether the signal supports the stock rally or not, while the Bullish, Neutral, and Bearish designations are about the trend.
A BEARISH trend signal does not mean we should not buy. A BULLISH trend signal does not mean you cannot sell some exposure. It depends on what is going on in the economy and how oversold/overbought the market is at a given point whether the Bearish signal is to be sold, sold on the next bounce, etc. and whether a Bullish signal is to be bought or if profits should be taken. A NEUTRAL trend signal does not mean the end of the Bull or Bear. It means to wait and look for possible subsequent entry points within the existing trend, Bull or Bear, but preserve capital if the entry fails. Our strong intention is to buy low and sell high. By the way, I will keep showing the prior orange “Trigger lines” in the charts for now as reference points only; they have historical value for us from the post-2016 election period.
Copyright © 2019 By Wall Street Sun and Storm Report, LLC All rights reserved.
