A Market Timing Report based on the 02-08-2019 Close, published Saturday, February 9th, 2019…
I deliver focused comments on market timing once a week. These are supplemented with daily “Tweets/StockTwits” (see links below) and comments in the “markettiming” room on StockTwits.
1. SP500 Index Market Timing (S&P 500 Index®; SPY, SPX):
As I discussed last week, Master Market and his spokespeople think “the Fed went dovish.” Not really. Cramer’s gushing about what “a good guy” Powell is this week vs. when he was basically using his “They know nothing!” line on him just weeks before is silly. Powell will raise rates if his mandate tells him to, Jim or no Jim on his side.
The Fed has a single mandate with employment at the current level and that is to prevent inflation much above their 2.0% PCE Inflation Index number. They won’t hike unless they have to, so perhaps that’s a minor win, but they won’t lower rates to “save the stock market” without economic data to support it. Otherwise they become the President’s puppets. He’s trying to stack the Fed with easy money people he can manipulate.
And get this straight please! The Fed going dovish IS NOT GOOD! Rates are supposed to rise in a recovery, so if in fact this is a recovery, rates should be rising! If they do rise, good for the Bulls. If not, good for the Bears. The Fed lowers rates after raising them when the economy is already going to heck in a handbasket. Watch Treasury Rates! Specifically, watch the 10 Year Yield as we do here every single week…
The China Trade Deal was back in the danger zone this week with rumblings that China and the U.S. were far apart in coming to an agreement. Trump won’t hike tariffs to 25% though I do not believe, because it would provoke the Chinese. The Chinese leaders are not the most flexible souls in the world, and they are not going to bend too far for Trump. Trump needs the markets to calm down so the capitalists love him more than the socialists now running for President hate him. Everybody is looking for love. He’ll feel pressured to make a deal. If he does not, and he brings on the 25% tariffs, the markets will dive. That would mean Economic World War III.
No news on Trump colluding even after the indictment of Roger Stone. Lots of talk out there, but nothing to bet on…
Speaking of Liberals… The single biggest threat to the market other than global economic slowing is the election of a liberal Democrat along with a Democrat sweep of both House and Senate. The danger is a politically violent reaction to everything Trump has done taxwise. Everything will be out the window in terms of what the market cares about most.
Back to the old estate tax levels or worse. Back to the Obama tax rates or worse. Back to the old corporate tax rates, which were already not competitive with the rest of the world, though the cuts did not promote much besides buybacks! I would have written the bill differently. The bill should have forced them to invest the repatriated money in the U.S. in order to bring it back at the low tax rate.
Extreme conservative choices are about to give birth to extreme liberal choices, and if this happens, the reaction of the market to a Democratic sweep will be harsh, because all the tax law changes will drive earnings down in a big way.
Speaking of Slowing Earnings Growth. It’s Especially Bad for Companies with More Sales Outside the U.S.
Read the details HERE from FactSet. From their report: “The blended (reported and estimated results) earnings growth rate for the S&P 500 for Q4 2018 is 13.3%. For companies that generate more than 50% of sales inside the U.S., the blended earnings growth rate is 16.6%. For companies that generate less than 50% of sales inside the U.S., the blended earnings growth rate is 8.4%.”
In other words, the companies that are inside the U.S. have earnings growth rates that are about double those doing business outside the U.S. And that is just the average, so be sure to determine where the companies you own as a shareholder lie on this curve! The FactSet revenue numbers were 7.0%, 7.2% and 6.7%, respectively, so earnings were hurt more than revenues in percentage terms.
But that was just 2018! 2019 numbers are even worse as they detail with the three earnings numbers (same order as above) 5.0%, 6.7%, and 1.9%, respectively. Revenues are expected to be 52.5% for the companies focused outside the U.S. vs. those focused at home.
If the economy accelerates, good. Then stock prices deserve to rise. If not, they will fall further.
Additionally, FactSet reports that the blended results and predictions are…
For 2018, companies are reporting earnings growth of 20.2% and revenue growth of 8.9%.
For 2019, analysts are projecting earnings growth of 5.0% and revenue growth of 5.1%.
If a PEG (PE to Earnings Growth Rate) ratio means the PE of a company is related to its earnings growth rate, then what do you think a drop of earnings growth from 20.2% to 5.0% means? Trouble. Do you really believe the stock market can ascend back to the prior highs based on those numbers, or a wild guess that things will be better “later”? If you do, back up the truck. If not, trade cautiously from here. If you buy, buy the companies that will maintain earnings growth! Do not buy the dogs hoping for a generalized economic recovery in the next 6 months…
No one can truly explain why this bounce has been as vigorous as it has been given the economic facts ahead. The lousy GDP results from Q4 have yet to be reported due to the shutdown by the way. Some said the market was just so oversold, it HAD to bounce. Well, be sure not to anchor on the past. As you read in the sentiment section shortly, there could be more to this pullback even if it’s to a higher low. The economic data suggests to me we’ll retest the prior Dec. 26th intraday low or penetrate it.
Read my comments on the VIX near the end of the report and my brief from last week on my trading strategy in case of a further rise in the market HERE.
Now let’s check in on two “Canary Signals” we’ve been following:
“Intel-igent Market Timing Signal” (Intel; INTC): Negative. My goalpost was dead on! The market rose intraday on 2-05-19 to 50.72 and then fell back below the 200 day moving average (mav).
The Bull Goalpost still remains: “A rise above 50.60 would change the current picture of a down trend since the June high.” Consider buying the stock on a close above there or a move through there depending on what the market looks like if you like Intel as an investment. I am using it here as a technical signal.
Bank of America (BAC) Market Timing Signal: Negative. The stock fell further from Tuesday to Thursday and bounced a bit when rates FELL on Friday. That makes no sense in terms of the impact of spreads on banks, so don’t expect much from BofA until rates start to rise consistently.
Keep up-to-date during the week at Twitter and StockTwits (links below) where a combined 33,829 investors are following the markets with me…
Follow Me on Twitter® Follow Me on StockTwits®.
Join the Conversation in the StockTwits “markettiming” Room
SP500 Large Cap Index (click chart to enlarge; SPX, SPY):
Notice the magenta downward sloping trend line coming down from the prior highs? It’s just above the 200 day moving average. If the market is going to fail, this looks like a good spot. If it does not fail, the Bulls could make some nice gains.
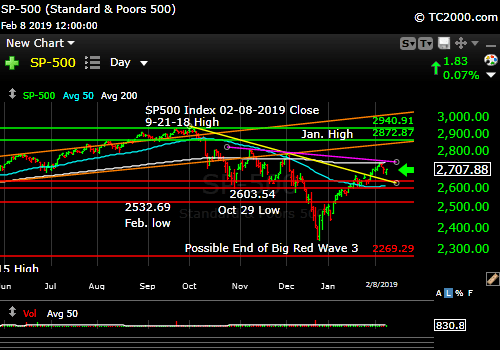
Pivot point.
Survey Says! Sentiment of individual investors (AAII.com) showed a Bull minus Bear percentage spread of +17.09% vs. +0.00% last week. This compares to (NOTE: The percent losses are all quick estimates using charting software, so they are rough):
6-13-18 23.1% High followed by 2.39% pullback
8-29-18 19.1% High followed by 1.13% pullback
10-03-18 20.5% High followed by 6.4% pullback
2-06-18 17.1% 2.0% pullback so far
More Bulls showed up this week. Each of the past highs at similar levels has come with a pullback. Sentiment at this level however is not at an extreme, so there is more room for the Bulls to play if they choose.
| Bulls | Neutrals | Bears |
| 39.87% | 37.34% | 22.78% |
| Thurs. 12 am CT close to poll | ||
2. U.S. Small Caps Market Timing (IWM): It’s a very risky choice to buy a stretched bounce in the small cap realm due to the higher beta of these stocks. They rise more on bounces, sometimes with a lag, but when they fall, they fall very hard…
Russell 2000 U.S. Small Cap Index (click chart to enlarge; IWM, RUT):
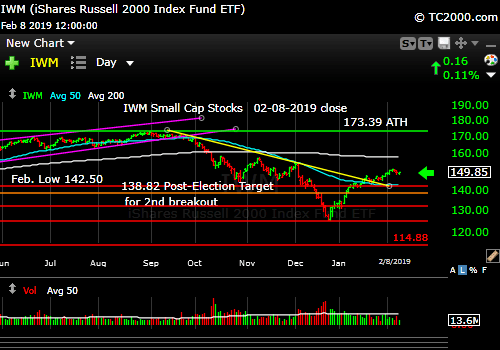
Above down trend, but is this a lower high?
3. Gold Market Timing (GLD): I’ve been buying GDX as a proxy for GLD with more beta as the trend is up for now. I bought GLD on Tuesday during a slight dip. Buy the dips in gold and gold stocks until the trend changes in my view.
The Gold ETF (click chart to enlarge the chart; GLD):
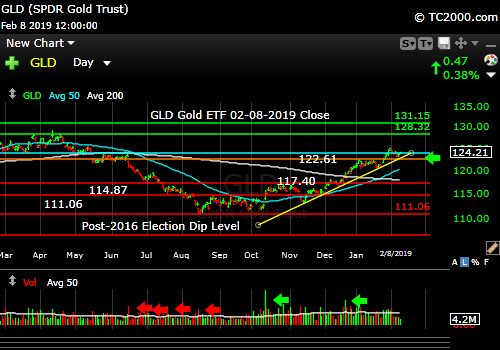
Gold uptrend continues, but watch rates and the US dollar.
4. Interest Rate Market Timing – U.S. 10 Year Treasury Note Yield (TNX):
Dumb Master Market gave us rising rates in a counter trend move Friday and Monday, when it had previously responded by falling when the Fed turned more dovish with its tail between its legs. Now it’s back down testing the prior low. Rates moving higher would signal a turn in the economy is indeed coming OR inflation is coming, which is why we follow both GDP and inflation! For now, I’m holding my Treasury exposure.
Check out the “Market Signal Summary” below – after you review the following chart…
U.S. 10 Year Treasury Note Yield (click chart to enlarge; TNX, IEF, TYX, TLT, TBF): Note the bounce up off the down trend line! DATE ON THE CHART SHOULD OBVIOUSLY BE FEB. 8TH.
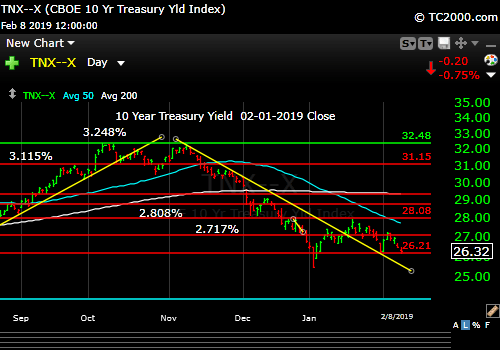
Held at higher low. Market decision pending.
Now let’s review three key market timing signals together….
Do not use these signals as a trading plan. They are rough guidelines. I currently share my own moves on social media (links above).
MY MARKET SIGNAL AND TREND SUMMARY for a Further U.S. Stock Market Rally with Real GDP Growth (“Real” means above inflation):
Stock Signal NEUTRAL for a further U.S. stock market rally with a NEUTRAL SP500 Index trend. (signal here is based on small caps) I will call the trend Bullish when small caps rise above the Dec. 3rd high.
The V*IX (which relates to SPX volatility; * added to symbol to throw off the webcrawlers!) closed at 15.72 vs. 16.14 last week. The Bulls have made progress and these targets are now targets for the Bears: : 15.94-15.95, 16.09, 17.06, 17.35 and 17.98. V*IX is now barely below its recent downtrend line. The market has a decision to make, likely as early as Monday morning.
The immediate Bull target is 15.04. The ‘Bull Nirvana Target’ is our V*IX # of 2018: 13.31.”
The V*IX Downtrend Line is at 15.84ish barely above the close on Friday at 4:15 pm ET.
Gold Signal RED for a further U.S. stock market rally with a BULLISH Gold Trend. A further GLD rally will be subject to interest rates, which will impact the U.S. dollar as explained above.
From before: “Remember GLD is being used as an indicator for the ECONOMY here.”
Rate Signal NEUTRAL for a further stock market rally with a NEUTRAL 10 Year Yield Trend. Because it fell to the prior higher low and stopped, I’ll call it neutral for now. The bias is down, but the market is expecting a recovery based on the jump in stock prices. But won’t estimates for future 2019 quarters to be reported come down even more as Europe and China continue to slow?
I said weeks ago, “Watch the oil price too. Higher oil tends to mean higher rates.” Oil fell back from a failed breakout which is Bearish, but the recent end of Jan. pullback has held its fall so far. 50ish could hold the fall and provide the next bounce if it breaks further however.
I previously warned about the Fed tightening process: “This level of the 10 Year Treasury Yield, which is too high for current conditions as explained HERE, will eventually slow the economy.” I said, “2.621% was the peak back in 2017 when stocks did best. Anything below that would be an improvement.” The close on Friday? 2.632%!
As for much higher rates and their possible impact, I said previously: “All heck would break loose for equities if TNX lurches above 3.248%, particularly if the rise is rapid. Buy long dated Treasuries as close as you can to 3.248% on the 10 Year Yield TNX (IEF, TLT, etc.).” In the Sept. 28th issue: “A rapid push higher in rates would mean trouble for stocks, as occurred in early 2018. That’s what I called ‘Rate Shock.'” The period of rising rates in early October was #RateShockII as I called it.
Thank you for reading. Would you please leave your comments below where it says “Leave a Reply”… or ask a question or report a typo…
Pay it forward by sending the link to MarketTiming.Blog (that link will immediately connect them to this webpage) to a relative or friend. Thanks for doing that.
Be sure to visit the website for more general investing knowledge at:
Standard Disclaimer: It’s your money and your decision as to how to invest it.
I thank Worden Brothers for the charting system I use to post these charts. If you want to know more about the charting system I use every day, go HERE. It makes it much easier to follow along with me if you can see the charts and manipulate them on your own computer. It’s a great investment to have an excellent charting system. Check it out with a free trial at the link above. I am an affiliate of Worden Brothers, though oddly I’ve never been paid a cent by them. If you HAVE subscribed to their service, please send me a message. 😉
Note: I’ve updated my criteria for the equity signal for a further U.S. stock market rally to the following: GREEN = Bullish, YELLOW = Neutral, RED = Bearish. In other words, the colors tell you whether the signal supports the stock rally or not, while the Bullish, Neutral, and Bearish designations are about the trend.
A BEARISH trend signal does not mean we should not buy. A BULLISH trend signal does not mean you cannot sell some exposure. It depends on what is going on in the economy and how oversold/overbought the market is at a given point whether the Bearish signal is to be sold, sold on the next bounce, etc. and whether a Bullish signal is to be bought or if profits should be taken. A NEUTRAL trend signal does not mean the end of the Bull or Bear. It means to wait and look for possible subsequent entry points within the existing trend, Bull or Bear, but preserve capital if the entry fails. Our strong intention is to buy low and sell high. By the way, I will keep showing the prior orange “Trigger lines” in the charts for now as reference points only; they have historical value for us from the post-2016 election period.
Copyright © 2019 By Wall Street Sun and Storm Report, LLC All rights reserved.

Thank you David! Any concerns regarding the National Debt? I’m for middle class tax cuts and I don’t see much from the administration current tax policy that would help working people. I try not to mix my money and politics but we have a corrupt government and that has to be addressed! If the liberals win it will be a buying opportunity and yes it will be bad however what we have now is inflated stock prices from easy money! I rather invest in a real market based on true fundamentals and if that means the markets crash so be it! We make money regardless of market directions thanks to YOU!
Hi Charles, Of course national debt is a concern vs. long term interest rates as well as the solvency and credit worthiness of our government. As rates rise, servicing that debt becomes a drag on the U.S. economy, because government spending has to shrink. A key threat would be the replacement of the U.S. dollar as the number one reserve currency by China. That would reset U.S. rates MUCH higher than they are now. For those interested in my Independent, fiscally conservative/socially tolerant views please see LeadInPresence on Twitter. I discuss politics only as they affect the market. I agree with Trump when he does something right, and disagree with him when I think his policies are detrimental.
Historically markets have done better under Democrats, but this time will be different IMO for the reasons cited. Trump will likely beat any socialist they try to put forward other than Bernie Sanders. He seems to have voters’ trust. Biden would beat Trump IMO. A moderate Democrat could beat Trump. If you buy all that, then who becomes the candidate really matters to the stock market, because any Democrat candidate will roll back part of Trump’s tax plan, which would hurt the U.S. stock market, while any ultra-liberal will reverse everything Trump has done. IF that happens, the U.S. markets will be ripped to shreds. The downward revisions of earnings would be massive.
And thanks for your continued and long term support, especially for sharing your very successful use of my market calls for many years now.