A Market Timing Report based on the 05-17-2019 Close, published Saturday, May 18th, 2019…
I deliver focused comments on market timing once a week. These are supplemented with daily “Tweets/StockTwits” (see links below) and comments in the “markettiming” room on StockTwits.
1. SP500 Index Market Timing (S&P 500 Index®; SPY, SPX):
As FactSet put it this week:
“The market has rewarded positive earnings surprises less than average and punished negative earnings surprises more than average during this earnings season.”
The losers dropped 1% more than they have in the past 5 years and the winners rose only an additional 0.3% per their data. What I meant by that “Blood in the Alleyways” expression was that alleyways lead into streets, given the common expression in a crashing market of “There is blood in the streets.”
There is certainly no “Blood in the streets” of late, but there are individual stocks (alleyways) that are flowing with blood. Gruesome, yes if you have held a stock such as Intel of late.
I’ve been emphasizing for weeks now to pick your stocks carefully. The market will reward solid growth and solid balance sheets. It will punish the losers mercilessly. Why? Because growth is slowing globally. Stagnating stocks are sold quickly and money is moved to the reliable growth companies. Examples of the “bloody alleyways”? INTC -24.7%. KLAC -15.8%. XLNX -26.0%. These are individual stocks in their own Bear markets.
How bloody will it get? We will check up on the technical strength of the market, but I gave you my “greater pullback” target in the issue from the first week in May (see links to upper right). This is simply a level where I believe buyers would step in with greater certainty.
This week we had a bit of a bounce after Monday and then a slight rollover back below the 50 day moving average (mav) of the SP500 Index. Since President Trump can induce a recovery rally with a few positive words about the China negotiations, it’s pointless to claim the market will reach any lower target in the near term. If the situation were to grind on and on and on, the market could suffer another leg down.
There is a big divide in the market between growing and shrinking companies in 2019. One growth stock mentioned two weeks ago, VEEV, with an off-the-charts valuation of EV/EBITDA of 83.01 is down only 2.70% from its all time high. That’s nearly the same pullback the SP500 Index has seen of 2.77%. Since VEEV has a beta of 1.67, we’d expect it to be down 1.67 X 2.77% or 4.63%. That means that despite the recent market dip, VEEV investors are still convinced that VEEV is a winner and will grow its revenue and earnings much faster than the SP500 Index, which is struggling to grow earnings at all amid higher costs and a deceleration of growth of the global economy.
Selling a stock because it’s expensive is not a successful strategy, because successful companies always become more expensive than they were when they were fumbling around. You could take off some profits, although that will blunt your returns.
Here’s the math. If you take off 100% of your principle at 100% gain, you would clear a profit of $550 from a $100 investment by the end of a 10-bagger run (you make 10 times your initial investment, but since you took out half at the 1-bag spot and pocketed $100, that means only $50 (half of your investment) makes it the whole way to the 10-bagger point. That becomes $500 minus your initial investment of $50, with your $100 profit added = $550. A full 10-bagger on $100 = $1000 (ten times your initial inv.) and that leaves a profit of $900.
That means “taking 100% profits when they accrue” would leave you with 61.1% of the profits vs. holding the position from a zero gain to a 10-bagger gain. Remember though, you’ve reduced your risk by selling some “early,” because you are playing with house money (profits). Your principal is secure and you may be less tempted to sell your position due to a temporary spike in volatility. That means you may make MORE money in the end by taking the 100% profits off the table.
Say you kept the stock until it was a 6-bagger (worth $600) and sold it all because the market then corrected and your stock, being more volatile (higher beta) fell much farther, say 20% vs. the market’s 10% fall. That would mean your position would be worth 80% X $600 or $480. So you bail from the entire position at the very bottom, because you just can’t take watching it fall any more, and your gain is $480-$100 (orig. investment) = $380 profit or $380 vs. $550 or 31% less in profit than if you sold your principle at 100% profits and rode the house money all the way, because you bailed early on your 10-bagger.
What creates very high tech stock valuations? Why would investors pay up so much for the stock? For comparison sake, MSFT and AAPL both sold for an EV/EBITDA of about 10 a few years ago. Now? MSFT is at 18.06 and AAPL is at 11.66. Apple is not growing its unit sales in iPhones of late, hit hard by falling purchases in China, while MSFT is still benefiting from cloud expansion and its Windows 10 upgrade cycle, major contributors to its growth. MSFT has control of 82% of the operating system market.
What’s the leading smartphone producer in the world? Samsung is the leader in unit sales with 27% share vs. Apple’s 24% share as of Sept. 2018 as noted HERE. That means the “moat” Apple has is worth somewhat less than Microsoft’s. Apple made $11.89 over ttm/$189 current price = Earnings Yield of 6.29% (Data HERE). That means if Apple can just maintain its profit margin and keep the replacement cycles going over time, and innovate enough to keep up with Samsung and others, and does not grow it’s revenues much, it could act like a bond for investors, supplying income without much growth at all. However, analysts are now expecting revenues to decline by 3.5% from 2019 to 2020. The stock is in a correction, now 12.2% off the top.
Investors are seeking growth and are willing to risk a market valuation readjustment (fall) that could impact the premium they are paying for MSFT vs. AAPL. The good news for VEEV, which has a valuation 4.6 X that of MSFT, is that the company would not likely be bid up to that valuation if it were not a solid company with a solid story (short of fraud of course), but the bad news is that the price can adjust severely in a general market sell-off. I’ll let you decide if the VEEV story is solid or not. I do not own the stock currently.
Is there risk embedded in the high valuation of VEEV’s growth? Yes. VEEV fell 26.9% from its Sept. 2018 high to its Dec. 2018 low. MSFT fell 19.1% by comparison, while SP500 Index fell 20.2% (intraday #s used). That gives you an idea of what could happen again, if the market corrects again as it did from Sept. to Dec. and almost all stocks become correlated in a rapid market decline. Investors are paying for VEEV growth from 2019 to 2020 of 17.8% in earnings and 17% in revenues. Is the price too high for that level of growth? This is the question the market asks of every company, every day.
If the PEG ratio were 2.0, that would mean the forward PE of VEEV would be 35.6. It is 64.14 on a forward basis per Yahoo Finance. The valuation is stretched and if the stock fell 44.5% it would arrive at a PEG ratio of 2.0. MSFT is expected to grow earnings by 18.3% from 2019 to 2020 and revenues by 11.o%. At a PEG of 2.0, the PE would be 36.6, and it’s 25.06 now. So comparing VEEV to MSFT and assuming the market would allow for a PEG of 2.0, one would say for current growth, VEEV is overvalued by 44.5% and MSFT is undervalued by 46%.
That “undervaluation” is relative remember, because I’m assuming PEG of 2.0 for MSFT. If we assume a more modest 1.5 PEG, MSFT implied PE = 27.45 vs. a current forward PE of 25.06. That means upside of 9.5%. That tells me that unless growth slows dramatically from here, MSFT does NOT look expensive. VEEV does look expensive.
I would protect profits in VEEV, take out 100% profits if I had them using a fairly tight stop, and check the volatility level, and decide how much slack to give the house’s money (decide how much of your profits you are willing to lose; your principle is now off the table). If you set a 5% stop on VEEV other than to preserve profits with a partial sale, you’ll never make it to a 10-bagger on your remaining “house money” position. It’s too volatile for such a stop. But you could set a stop for preserving 100% profits if you have them and then another wider stop to account for significant volatility along the way.
All your stocks need this sort of checking, so use the link above to be sure you are getting the growth for which you are paying. Facebook will grow its revenue by 21.2% from 2019 to 2020, but its earnings per analysts will fall by 6.9% over that period. Should investors pay for an EV/EBITDA of 17.98 with earnings falling? If so, why? Do you believe the “why”?
Again, after the action this week, despite these concerns about areas of overvaluation in the market, I do yet do not believe the market has topped, even if it pulls back into a full correction (definitions I use are here; scroll to : “New Rules”)
Let’s check in with the earnings trend again…
Earnings Risk: what is shown are the projections in the FactSet 3-15-19 report followed by the reports from 4-12-19 through 5-17-19 (details HERE)…
Only an additional 2% of companies in the SP500 Index (92% total) reported this week, and earnings growth for Q1 remained at a -0.5%, which if unchanged would represent the first quarter of earnings recession. Companies are selling more and making less money on the sales. Q2 is already expected to show an earnings contraction and Q3 could turn negative over time.
Here is the data updated for the last data point from this week:
For Q1 2019, analysts are projecting (mostly reported!) earnings growth of -3.6% -> -4.3% -> -3.9% -> -2.3% -> -0.8% -> -0.5% -> -0.5%.
and revenue growth of 4.9% -> 4.8% -> 5.0% -> 5.1% -> 5.2% -> 5.3% -> 5.3%.
For Q2 2019, analysts are projecting earnings growth of 0.1% -> -0.4% -> -0.5% -> -0.6% -> -1.3% -> -1.7% -> -1.9%.
and revenue growth of 4.6% -> 4.2% -> 4.4% -> 4.3% -> 4.3% -> 4.3% ->4.2%.
For Q3 2019, analysts are projecting earnings growth of 1.8% -> 1.4% -> 1.3% -> 1.3% -> 0.8% -> 0.6% ->0.5%.
and revenue growth of 4.4% -> 4.1% -> 4.4% -> 4.4% -> 4.4% -> 4.3% -> 4.3%.
For Q4 2019, analysts are projecting earnings growth of 8.1% -> 8.3% -> 8.2% -> 8.1% -> 7.5% -> 7.4% ->7.3%.
and revenue growth of 4.8% -> 4.7% -> 4.7% -> 4.8% -> 4.8% -> 4.6% -> 4.7%.
For CY 2019, analysts are projecting earnings growth of 3.8% -> 3.4% -> 3.4% -> 3.6% -> 3.4% -> 3.3% -> 3.2%.
and revenue growth of 4.9% -> 4.6% -> 4.7% -> 4.7% -> 4.7% -> 4.7% -> 4.7%.
Are the Bulls serious? As I asked six weeks ago…
What would satisfy me that the Bulls were serious about this advance?
Let’s check that list once again…
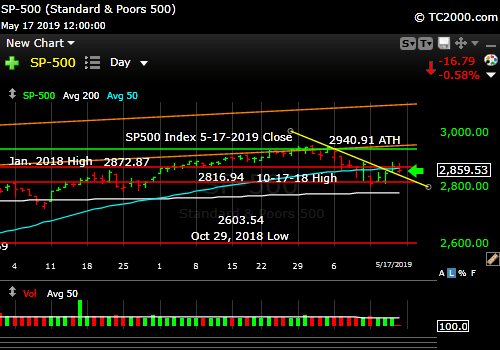
1. New high. Nope. The SP500 Index failed a breakout above the 9-21-2018 high and is now down 3.21% off the new ATH of 2954.13 (it’s a dip, so far, as defined by my “New Rules” HERE).
2. VIX below the “Bull Nirvana Number” AND my bonus number? No. With a 15.96 close on Friday, just as last week, it’s landed exactly within the “fulcrum range” (see VIX targets at base of report) once again. The market can cut either way from here.
3. AD % Line: No go. 16,277 vs. 16,385 vs. the prior high of 16471 on 5-01. Needs a new high now, although it did bounce with the market after the Monday drop.
4. Volume: No go. Actually notably negative as volume was higher on ALL days the market fell from the top, and it did not rise on the up days. The story is the same for IWM and for IJH, except on Friday, when IJH volume fell as the market fell, and its price dropped 1.11%.
5. The “U.S. Index Matrix Signal” as I call it: No go. Both small caps and mid caps have rolled over to fall below their 50 and 200 day mav’s.
Here’s a Brief Review of the Other Market Risks at Hand:
China Deal Risk: President Xi supposedly reneged on his prior agreements and Trump called foul! They are not talking for now with no dates set. Negative for all companies doing business in China.
U.S. Iran War Risk: From NBC on why Congress, even Republicans are not happy with the Presidential use of war powers without Congressional approval. Ref. The risk of war continues to rise. You can see bubbles in the pot, but it’s not boiling fully yet. Iran says it’s not interested in a war. If attacked, it would be.
Mexico Border Closing Risk: President Trump folded under Republican pressure. It’s not going to happen unless things get much worse.
Mueller Report Risk: I covered this HERE. The likelihood of a Trump impeachment has fallen.
2020 Election Risk: June Democrat debates on their way with Joe Biden still the track favorite. Read my comments on this HERE.
Deficit Threat: Moderate, but more an issue when rates are rising, not when stable to falling. This is an ongoing threat to our current system, and fiscal liberal Trump doesn’t have a fiscal conservative bone in his body. He warned us saying “I love debt!” before he was elected.
Fed Rate Hike Risk: Low. The Fed is stuck in neutral with opposing forces of rising oil prices and falling global inflation.
What’s my SP500 Index downside market timing target? I covered that last week at the end of the SP500 section #1: HERE. I have more cash than I would normally in a Bull market, because of the catalyst risks noted above. I’ll update my current allocation to equities by Sunday on social media (links below). My belief currently is that my cash will pay off when I’m able to add to equity exposure at lower prices (10-20% off the top). It has NOT paid to hold extra cash recently other than the interest of 2.3ish%.
You can ALWAYS perform “with the market” if you always stay fully invested in your maximum Bullish equity exposure to the SP500 Index and other indexes in your investment plan (small cap, mid cap, and foreign exposure etc.) and rebalance those exposures when they slip or rip. That means to outperform the market using the indexes themselves via ETFs, you must sell exposure higher and buy it back lower.
Now take a look at the SP500 chart. The orange lines are the 2017 up channel.
NOTE: The last volume bar is not correct. SPY volume was higher vs. the prior day on Fri. The close Friday was just barely above the low of the prior consolidation beginning on 5-07. Being above trend (downward slanting yellow line) is good, but the market could cut either way on Monday with this set-up. I call that “NEUTRAL” as a trend as noted in the signal section below, based on my net technical assessment.
SP500 Large Cap Index (click chart to enlarge; SPX, SPY):
Not out of the woods yet.
Now let’s check in on two “Canary Signals” we’ve been following:
“Intel-igent Market Timing Signal” (Intel; INTC): Outright Bearish. Discussed above.
Bank of America (BAC) Market Timing Signal: Negative. Fell on increased volume as rates dropped further. Down on Mon. and failed to rally with market, because rates fell back to test the prior lows.
Now let’s go on to review investor sentiment…
Keep up-to-date during the week at Twitter and StockTwits (links below) where a combined 33,951 investors are following the markets with me…
Follow Me on Twitter® Follow Me on StockTwits®.
Join the Conversation in the StockTwits “MarketTiming” Room
Survey Says!
Sentiment of individual investors (AAII.com) showed a Bull minus Bear percentage spread of -9.48% vs. +19.93% last week. Investors could become a lot more Bearish than this, and this is the first negative number since sentiment turned positive in the 1-09-2019 poll reported on 1-10-2019. The swing was big enough to allow for a bounce, but we’ve had that, and now small and mid caps are leading the way down. I read the sentiment numbers as negative for the near term, which would lead to a deeper correction, not just a “dip” as I define it in my “New Rules.”
| Bulls | Neutrals | Bears |
| 29.82% | 30.88% | 39.30% |
| Thurs. 12 am CT close to poll | ||
2. U.S. Small Caps Market Timing (IWM): Small caps had a Bullish engulfing day that did not produce gains. As I said last week, candlestick signals work a certain percentage of the time, more than not, but the not is what we got! Have been staying out of most small caps for a reason (see prior issues). Stick with the growth winners, but if they fail to produce, cut them from your roster.
Russell 2000 U.S. Small Cap Index (click chart to enlarge; IWM, RUT):

Leading the market down.
3. Gold Market Timing (GLD): Rates fell but the dollar rose for the past 5 days. That has pressured gold again. It’s back in a Bullish wedge, but less Bullish for having lost its trend. GLD failed a milder looking downward wedge back in April to July 2018 and just kept falling, so I’d call GLD at least short term Bearish. That says investors are “running to” dollars and U.S Treasuries, not gold. When our dollar strengthens gold drops.
When financial panic occurs, gold and USD can go up together, but we’re not there yet. If the Fed cuts rates should things unravel further or even if led by the nose by the bond/Treasury market, the dollar will weaken and gold will rise. So I choose to be patient for now with my smaller trading gold position and of course, my core long position.
The Gold ETF (click chart to enlarge the chart; GLD):

Slipped back into the downward wedge (yellow lines). Not what we wanted to see, though it still could be resolved to the upside.
4. Interest Rate Market Timing – The 10 Year Yield FELL this week from 2.455% to 2.393% from Fri. to Fri or 6.2 basis points after falling 7.6 basis points the prior week. This is a Bearish signal for the U.S. economy. The test above 2.554% failed on 5-03-19, the first target for the Rate Bulls.
Check out the “Market Signal Summary” below – after you review the following chart…
U.S. 10 Year Treasury Note Yield (click chart to enlarge; TNX, IEF, TYX, TLT, TBF):

Testing the prior low.
Now let’s review three key market timing signals together….
Do not use these signals as a trading plan. They are rough guidelines. I currently share my own moves on social media (links above).
MY MARKET SIGNAL AND TREND SUMMARY for a Further U.S. Stock Market Rally with Real GDP Growth (“Real” means above inflation):
Stock Signal RED for a further U.S. stock market rally with a NEUTRAL SP500 Index trend. The stock signal is based on small caps, as they often lead the market down.
The V*IX (which relates to SPX volatility; * added to symbol to throw off the webcrawlers!) closed at 15.96 vs. 16.04 last week. These are the other targets: 13.31, 14.04-14.08, 15.04, the “fulcrum” point = [15.94-15.95 to 16.09], 17.06, 17.27, and 17.89. The bonus target #8 is [12.-17-12.37]. The Bulls still have 3 of 8 targets. Bears 4. And one tie. Same as last week, though the score went to Bulls 0/Bears 8 this past week, and then recovered.
The ‘Bull Nirvana Target’ is our V*IX # of 2018: 13.31.” (That is target #7 for the Bulls.)
Gold Signal GREEN for a further U.S. stock market rally with a BEARISH Gold Trend. What gold does mostly as I’ve written HERE is follow real interest rates.
STILL HOLDS 4-26-19: G*LD has to rise above 123.19 on an immediate basis (* added to throw off the “crawlers,” as I don’t like being part of “consensus.”)
From before: “Remember GLD is being used as an indicator for the ECONOMY here.” If gold continues to rise, it means the market believes real rates will fall, which in the current context means the global economy is slowing. That would hurt U.S. stocks.
Rate Signal RED for a further stock market rally with a Bearish 10 Year Yield Trend. Rates usually RISE slowly in a strong recovery and the stock market rally continues, as I’ve repeated multiple times on social media as well as here. Empirically though, rates that are “lower” (than 3.11%) and are NOT rising rapidly have allowed the market to climb back above the prior all time high (ATH).
I said weeks ago, “Watch the oil price too. Higher oil tends to mean higher rates.” WTI was stable this week and closed at 62.92 vs. 61.66 last week. term (weeks to a few months).
I’ll keep this here as a reminder: this is not currently an issue… “Watch the rate at which TNX climbs if the current trend reverses. If it shoots up very fast, stocks will correct.” In the Sept. 28th issue: “A rapid push higher in rates would mean trouble for stocks, as occurred in early 2018. That’s what I called ‘Rate Shock.'” The period of rising rates in early October I called #RateShockII.
Thank you for reading. Would you please leave your comments below where it says “Leave a Reply”… or ask a question or report a typo…
Pay it forward by sending the link to MarketTiming.Blog (that link will immediately connect them to this webpage) to a relative or friend. Thanks for doing that.
Be sure to visit the website for more general investing knowledge at:
Standard Disclaimer: It’s your money and your decision as to how to invest it.
I thank Worden Brothers for the charting system I use to post these charts. If you want to know more about the charting system I use every day, go HERE. It makes it much easier to follow along with me if you can see the charts and manipulate them on your own computer. It’s a great investment to have an excellent charting system. Check it out with a free trial at the link above. I am an affiliate of Worden Brothers, though oddly I’ve never been paid a cent by them. If you HAVE subscribed to their service, please send me a message. 😉
Note: I’ve updated my criteria for the equity signal for a further U.S. stock market rally to the following: GREEN = Bullish, YELLOW = Neutral, RED = Bearish. In other words, the colors tell you whether the signal supports the stock rally or not, while the Bullish, Neutral, and Bearish designations are about the trend.
A BEARISH trend signal does not mean we should not buy. A BULLISH trend signal does not mean you cannot sell some exposure. It depends on what is going on in the economy and how oversold/overbought the market is at a given point whether the Bearish signal is to be sold or bought, sold on the next bounce, etc. and whether a Bullish signal is to be bought or if profits should be taken. A NEUTRAL trend signal does not mean the end of the Bull or Bear. It means to wait and look for possible subsequent entry points within the existing trend, Bull or Bear, but preserve capital if the entry fails. Our strong intention is to buy low and sell high. By the way, I will keep showing the prior orange “Trigger lines” in the IWM and GLD charts for now as reference points only; they have historical value for us from the post-2016 election period.
Copyright © 2019 By Wall Street Sun and Storm Report, LLC All rights reserved.
