A Market Timing Report based on the 06-28-2019 Close, published Saturday, June 29, 2019…
I deliver focused comments on market timing once a week. These are supplemented with daily “Tweets/StockTwits” (see links below) and comments in the “markettiming” room on StockTwits.
I provide quite a bit of intraweek commentary, and if you miss it, you will miss out on quite a bit of context, so please click on the social media links below and have a read… Thank you as always for being loyal readers and interacting on social media with your questions and comments!
1. SP500 Index Market Timing (S&P 500 Index®; SPY, SPX):
When the market is again within spitting distance of the April ATH (all time high), and Trump wrestles with Xi over our economic future, we must ask…
Are the Bulls serious?
What would satisfy me that the Bulls are serious about this advance?
Let’s check the list once again… The Score? Bull 2: Bears 3. For each checklist item below, I give you the points scored as Bullish or Bearish. The Bulls picked up some strength this week, but we’re headed into a troublesome earnings season. Not to mention other trouble spelled “Democratic Candidates.” Even if you are Democrat (I’m an independent who has been known to vote for the best people!), you must realize the threat they pose to corporate earnings if tax rates are ratcheted back up.
1. New high. Bears 1 point. Because the AD% Line (see below) made a new closing high, but price did not, I’ll score this as a negative. The SP500 Index has been above the Wave 2 top, since 6-13-19. That’s a positive. We avoided marking a weaker lower high in doing that.
2. VIX below the “Bull Nirvana Number” AND my bonus number? Bears 1 point. The Bears get this point, because of the lack of progress during a week when the market was close to re-topping. Last week the VIX close was 15.40. This week? 15.08. The Volatility Game Score as I call it is still Bulls 4/Bears 4. As before, the Bulls have a slight edge, having overtaken the “fulcrum,” which is that 4th Bull point.
3. AD % Line: Bulls 1 point. The prior high on May 1st when the market topped out was 16,471, and the prior closing high on May 20th was 16, 483. The close Fri. was 16,495, which is above there. It is a new closing high, but not a new intraday all time high. Still, it is a positive.
4. Volume: Bulls 1 point. SP500 Index volume was high on Friday. There was quarterly options expiration, but the volume far exceeded that seen either last quarter or last year, so the Bulls win this one.
5. The “U.S. Index Matrix Signal” as I call it: Bears 1 point. I score this on the MAJOR TREND. Small caps hit support and bounced on Thursday and Friday, so it’s not enough to say the intermediate term trend has changed, but renders the immediate trend neutral – it could just be bouncing temporarily within a lower range. A new high would be needed above 156.22 AND 161.11 on a close to change the picture to Bullish, on the immediate term time frame. The Friday close was 155.50. All we have so far is a set of two lower highs below two other lower highs. Not good enough.
What about mid caps? The close for IJH was 194.26 with the two goalposts for a trend change to UP at 194.75 and 198.31. The prior all time high (ATH) on 205.47 was on 9-21-2019 when the large caps, i.e. SPX, topped. The small caps topped out earlier on 8-31-19. The fact that the midcaps as well as the small caps are not tracking with the large caps in the recovery rally, tells us it is a weaker rally.
As I said last week: “The U.S. Stock Market Topped on August 31st, 2018!” Read that issue (link upper left) if you haven’t…
Let’s check in on the context around the price action of the market by looking at the current RISKS…
Earnings Risk: what is shown are the projections in the FactSet 3-15-19 report followed by the reports from 4-12-19 through 6-28-19 (details HERE)…
Q2 earnings are reported in earnest starting in mid-July, although Pepsi will report on July 9th (See July Earnings Calendar). Some companies like Apple have not announced their earnings report dates. Note that earnings were negative in Q1 per FactSet and are slated to be negative for Q2 and Q3 unless something changes. That means we are entering an Earnings Recession with Q2 earnings, unless companies beat the current estimates.
The real question the markets face is whether the decline in earnings will find a softer landing than a recession, which by definition means two quarters of back to back negative growth. GDP is estimated by the N.Y. Fed to be in the mid-1’s for Q2, but they’ve been way off before. We get that big Q2 GDP number on July 26th. Recessions are market wounders and killers depending on how bad they are in GDP negative growth terms.
Are you tanked up on tech going into earnings? I hope you’ve reviewed all the tech stocks you own, and they all plan on beating earnings, or their stock prices will drop like a rock, because as FactSet stated:
“The Information Technology sector is expected to report the second highest (year-over-year) earnings decline of all eleven sectors at -11.9%. At the industry level, two of the six industries in this sector are predicted to report a decline in earnings: Semiconductors & Semiconductor Equipment (-31%) and Technology Hardware, Storage, & Peripherals
(-22%).”
Here is the data updated for the last data point from this week:
For Q2 2019, analysts are projecting earnings growth of 0.1% -> -0.4% -> -0.5% -> -0.6% -> -1.3% -> -1.7% -> -1.9% -> -2.1% -> -2.1% -> -2.3% -> -2.5% -> -2.6% -> -2.6%.
and revenue growth of 4.6% -> 4.2% -> 4.4% -> 4.3% -> 4.3% -> 4.3% ->4.2% -> 4.1% -> 4.1% -> 4.0% -> 3.9% -> 3.9% -> 3.8%.
For Q3 2019, analysts are projecting earnings growth of 1.8% -> 1.4% -> 1.3% -> 1.3% -> 0.8% -> 0.6% ->0.5% -> 0.3% -> 0.3% -> 0.2% -> 0.0% -> -0.3% -> -0.5%.
and revenue growth of 4.4% -> 4.1% -> 4.4% -> 4.4% -> 4.4% -> 4.3% -> 4.3% -> 4.2% -> 4.2% -> 4.1% -> 4.0% -> 4.0% -> 3.8%.
For Q4 2019, analysts are projecting earnings growth of 8.1% -> 8.3% -> 8.2% -> 8.1% -> 7.5% -> 7.4% ->7.3% -> 7.2% -> 7.2% -> 7.0% -> 6.8% -> 6.7% -> 6.3%.
and revenue growth of 4.8% -> 4.7% -> 4.7% -> 4.8% -> 4.8% -> 4.6% -> 4.7% -> 4.6% -> 4.6% -> 4.5% -> 4.5% -> 4.5% -> 4.3%.
For CY 2019, analysts are projecting earnings growth of 3.8% -> 3.4% -> 3.4% -> 3.6% -> 3.4% -> 3.3% -> 3.2% -> 3.2% -> 3.2% -> 3.1% -> 3.0% -> 2.8% -> 2.7%.
and revenue growth of 4.9% -> 4.6% -> 4.7% -> 4.7% -> 4.7% -> 4.7% -> 4.7% -> 4.7% -> 4.6% -> 4.5% -> 4.5% -> 4.5% -> 4.4%.
For Q1 2020, analysts are projecting earnings growth of 10.5% -> 10.7% -> 10.3 -> 9.9%.
and revenue growth of 6.2% -> 6.1% -> 6.0% -> 5.8%.
For Q2 2020, analysts are projecting earnings growth of 12.9% -> 13.3% -> 13.3% -> 12.9%.
and revenue growth of 6.8% -> 6.8% -> 6.8% -> 6.6%.
Despite the slowing growth in earnings, analysts expect this from the SP500 Index over the next 12 months per FactSet: “The bottom-up target price for the S&P 500 is 3218.88, which is 10.1% above the closing price of 2924.92″ (they seem to have an error as the Friday close was 2941.76 for a 9.42% rise in the next 12 months).
Here’s a Brief Review of the Other Market Risks at Hand:
China Deal Risk: Chinese President Xi apparently agreed to step up farm product purchases, but wants the Huawei ban lifted by President Trump, who said he was OK with products being sold to Huawei by U.S. companies IF they don’t endanger our national security. Both sides agreed to wait on further tariffs. A Huawei ban lift is not a done deal yet though. Trump cannot afford to wait too long to make a comprehensive deal. Nothing was said at the G20 meeting about forced tech transfer and tech patent violations. Much remains to be resolved. More here @CNBC.
IMF Chief Lagarde said “While the resumption of trade talks between the United States and China is welcome, tariffs already implemented are holding back the global economy, and unresolved issues carry a great deal of uncertainty about the future.”
U.S. Iran War Risk: Things have calmed down even though President Trump threatened to obliterate the country of Iran should they attack Americans, military or otherwise. Iran is a terrorism supporting country that needs to come out of the darkness.
Mueller Report/Impeachment Risk: “Mueller Time” is Wednesday, July 17th. Mark your calendar for market risk on that day. Just by repeating certain conclusions, he could influence public opinion against Trump. That’s what the Democrats hope.
2020 Election Risk: Probably the biggest risk to the markets and most Americans are oblivious to this from the markets’ point of view. I’ll stand by this: The market will likely pull back at least 10-15% going into the election if the outcome is even unclear, meaning Trump is NOT ahead by a wide margin (a likelihood, but not a certainty, depending on whether the Dems go for a “McGovern” candidate, as in Nixon-McGovern in 1972, a Democrat disaster.
Deficit/Debt Threat Unchanged. Building in the background, dollar by dollar. This is a building threat but won’t manifest until our interest rates climb and then it will put huge pressure on the U.S. economy and suppress earnings through higher borrowing costs.
Fed Rate Cut Risk: Now this week we had Bullard, the super Federal Reserve dove that he is, come out and saying a 0.50% cut would be “excessive” for July. Oddly enough, investors still believe the Fed cut cut 0.50% in July! This is pretty amazing considering Bullard’s comment.
In my view, many investors are in LalaLand when it comes to rat cuts. CME Group says 28.1% still believe the Federal Reserve will cut 0.50% in July. The rest expect a cut of 0.25%. No cut would cause the market to dive. A cut of just 0.25% could disappoint the market as well, although the majority would be fine as they expect that cut.
From last week: Three cuts are expected by December 2019. The Fed members actually don’t believe that yet however, as I summarized HERE. Bullard’s view is not the majority view yet.
Now take a look at the SP500 chart. The orange lines are the 2017 up channel.
SP500 Large Cap Index (click chart to enlarge; SPX, SPY):
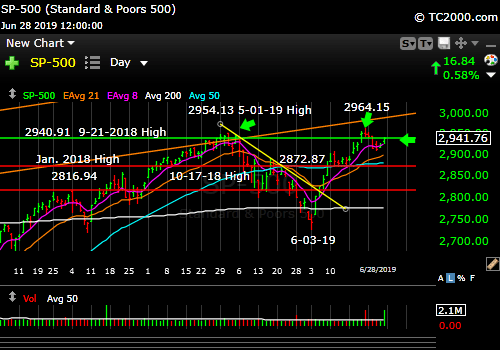
Near the prior ATH.
Now let’s check in on two “Canary Signals” we’ve been following:
“Intel-igent Market Timing Signal” (Intel; INTC): Neutral. Now subject to economic gravity despite China. It edged up to the 50 day moving average and has been playing with it for the past 3 days, not rising above it. Negative. 47.32 was the last breakout that must be held with a Friday close at 47.87. A China trade resolution would be very helpful to Intel, and that’s what the rally has been about.
Bank of America (BAC) Market Timing Signal: Neutral. Despite the Federal Reserve gearing up to lower rates several times, a negative for banks’ interest rate margins, BAC rose above the down channel, which was its first test. It’s likely to stall out by the time it reaches the 2018 -2019 highs. Don’t expect much until things start improving vs. deteriorating from an economic and rising rates point of view. Only a strengthening global economy will help the banks recover.
Now let’s go on to review investor sentiment…
Keep up-to-date during the week at Twitter and StockTwits (links below) where a combined 34,055 investors are following the markets with me…
Follow Me on Twitter® Follow Me on StockTwits®.
Join the Conversation in the StockTwits “MarketTiming” Room
Survey Says!
Sentiment of individual investors (AAII.com) showed a Bull minus Bear percentage spread of -2.46% vs -2.62% the prior week. That could be the smallest change I’ve ever seen week over week.
The rest is the same as last week: “As before, sentiment should be more Bullish at a test of a prior all time high. Over the short term, I view this as Bearish, because the price action is failing to change sentiment in a positive way. The other side of that coin is there are more investors to convert into being Bulls. For this reason, sentiment is not too helpful here in the middle.
At the same time, we have not likely seen the ultimate top of this Bull market, at least for the large caps, because sentiment is just not positive enough. Investors came closest to euphoria at the end of January 2018, but that was 7 months prior to the small cap market top on August 31st. Remember we had a “Mini Bear Market” in December, but no “Big Bear” as defined HERE under “New Rules.” A “Big Bear” is by definition required to terminate a Bull market.”
| Bulls | Neutrals | Bears |
| 29.59% | 38.36% | 32.05% |
| Thurs. 12 am CT close to poll | ||
2. U.S. Small Caps Market Timing (IWM): Discussed above including immediate Bull targets.
Russell 2000 U.S. Small Cap Index (click chart to enlarge; IWM, RUT):

Another bounce, but still lagging.
3. Gold Market Timing (GLD): Still a Bull. I bought on this week’s pullback as I stated I would. Follow the rate trend along with the gold chart!
The Gold ETF (click chart to enlarge the chart; GLD):

Gold is in an uptrend. Stick with it!
4. Interest Rate Market Timing Still a Bear in rates, Bull in Treasuries. Stay with the trend. Buy the bounces in rates until the trend changes – then get the heck out!
This is a trade that could last just a few weeks or many months. Why? Because rates are very low and due to the current weakness globally. As the world perks up eventually, so will interest rates, and both bonds and Treasuries will fall.
Check out the “Market Signal Summary” below – after you review the following chart…
U.S. 10 Year Treasury Note Yield (click chart to enlarge; TNX, IEF, TYX, TLT, TBF):

Rate trend is down for now with room for bounces. Buy Treasuries on the bounces.
Now let’s review three key market timing signals together….
Do not use these signals as a trading plan. They are rough guidelines. I currently share my own moves on social media (links above).
MY MARKET SIGNAL AND TREND SUMMARY for a Further U.S. Stock Market Rally with Real GDP Growth (“Real” means above inflation):
Stock Signal RED for a further U.S. stock market rally with a Bullish SP500 Index trend. The stock signal is based on small caps, as they often lead the market down. Since the major trend is Bearish still for small caps, I’ll call the signal RED.
The V*IX (which relates to SPX volatility; * added to symbol to throw off the webcrawlers!) See above for the close this week and other comments. These are the targets: 13.31, 14.04-14.08, 15.04, the “fulcrum” range = [15.94-15.95 to 16.09], 17.06, 17.27, and 17.89. The bonus target #8 is [12.-17-12.37]. The Bulls have 4 of 8 targets. I consider the “fulcrum” the key decision point that turns the market from Bearish to Bullish, when the VIX falls below that entire fulcrum range. It’s still leaning Bullish, but with no progress made this week at a time we are near the SPX ATH.
The ‘Bull Nirvana Target’ is our V*IX # of 2018: 13.31.” (That is target #7 for the Bulls.)
Gold Signal RED for a further U.S. stock market rally with a BULLISH Gold Trend. What gold does mostly as I’ve written HERE is follow real interest rates.
From before: “Remember GLD is being used as an indicator for the ECONOMY here.” If gold continues to rise, it means the market believes real rates will fall, which in the current context means the global economy is slowing. That will ultimately hurt U.S. stocks.
Rate Signal RED for a further stock market rally with a Bearish 10 Year Yield Trend. For Reference: “Rates usually RISE slowly in a strong recovery and the stock market rally continues as they rise, as I’ve repeated multiple times on social media and here. Empirically though, rates that are “lower” (than 3.11%) and are NOT rising rapidly have allowed the market to climb back above the prior all time high (ATH).”
I said weeks ago, “Watch the oil price too. Higher oil tends to mean higher rates.” WTI has been weak but is stabilizing a bit at a lower level. It closed at 58.47 vs. 57.43 last week and is losing steam just as the 50 day mav is almost down to the 200 day mav.
I’ll keep this here as a reminder: this is not currently an issue… “Watch the rate at which TNX climbs if the current trend reverses. If it shoots up very fast, stocks will correct.” In the Sept. 28th issue: “A rapid push higher in rates would mean trouble for stocks, as occurred in early 2018. That’s what I called ‘Rate Shock.'” The period of rising rates in early October I called #RateShockII. The risk lately has been the “Negative Rate Shock I” we’ve seen as discussed above.
Thank you for reading. Would you please leave your comments below where it says “Leave a Reply”… or ask a question or report a typo…
Pay it forward by sending the link to MarketTiming.Blog (that link will immediately connect them to this webpage) to a relative or friend. Thanks for doing that.
Be sure to visit the website for more general investing knowledge at:
Standard Disclaimer: It’s your money and your decision as to how to invest it.
I thank Worden Brothers for the charting system I use to post these charts. If you want to know more about the charting system I use every day, contact me. It makes it much easier to follow along with me if you can see the charts and manipulate them on your own computer. It’s a great investment to have an excellent charting system.
Note: I’ve updated my criteria for the equity signal for a further U.S. stock market rally to the following: GREEN = Bullish, YELLOW = Neutral, RED = Bearish. In other words, the colors tell you whether the signal supports the stock rally or not, while the Bullish, Neutral, and Bearish designations are about the trend.
A BEARISH trend signal does not mean we should not buy. A BULLISH trend signal does not mean you cannot sell some exposure. It depends on what is going on in the economy and how oversold/overbought the market is at a given point whether the Bearish signal is to be sold or bought, sold on the next bounce, etc. and whether a Bullish signal is to be bought or if profits should be taken. A NEUTRAL trend signal does not mean the end of the Bull or Bear. It means to wait and look for possible subsequent entry points within the existing trend, Bull or Bear, but preserve capital if the entry fails. Our strong intention is to buy low and sell high. By the way, I will keep showing the prior orange “Trigger lines” in the IWM and GLD charts for now as reference points only; they have historical value for us from the post-2016 election period.
Copyright © 2019 By Wall Street Sun and Storm Report, LLC All rights reserved.
