A Market Timing Report based on the March 13, 2020 close…A Mid-Month Update
The context for the charts will be addressed on social media during the week…be sure to read those posts as well, or you’ll miss at least half of the picture.
NOTE: I am publishing just after the last Friday/Holiday close of the week each month, so if the last Friday precedes the end of the month, I will publish on that corresponding weekend. (for example, posts will be on 2-29, 3-28, 4-25, 5-30, 6-27 or the day after, meaning on Saturday most likely, but at the latest by the day prior to the next week’s open, and in case of a holiday, meaning by Monday evening.) I may publish earlier each month if the market action requires it…
If you want to be alerted to each post, please subscribe via WordPress, and you’ll receive an email each time I publish here… Thanks and feel free to comment or leave a question below…
1. SP500 Index Market Timing (S&P 500 Index®; SPY, SPX):
I will only give you part of the story here. Go to my social media links below for more context please.
The Federal Reserve confirmed my thesis spelled out below as I was writing this… I share their late Sunday actions (not in a panic are they?) below…
1. A US recession has entered the HIGH RISK range of probabilities, which means 2 quarters of GDP slowing. This is now most likely a given, although I suppose the 2 quarter part is arguable. What matters is how fast the coronavirus is shut down.
There are 3 possibilities:
1. Too much of the country fails to go on lockdown as China and South Korea have done, where the virus is losing now, especially in China. China has had under 100 cases per day for several days now, so a lockdown or, my preferred term, #NationalCoronavirusVacation, as I called it on social media, WILL WORK! If we do not do that, we could have 10’s of thousands of deaths. It’s simple math. Our numbers have been looking like Italy’s, and there are now cases in every state but West Virginia, so this is a pandemic.
My message? Take it seriously now, or many will needlessly die. Why? Because each age group/at risk group has certain odds of dying if infected. That means the more exposed to the virus, the more who will die. Again, it does not have to happen, but it will if our response is not much more vigorous than what is happening now in a very piecemeal fashion. Families who have hourly wage employees, should be compensated to stay home. School lunches could be picked up OR even delivered to homes using the same school buses that take the kids to school. We need to be creative.
#NationalCoronavirusVacation: A Proposal…
- Shut down the entire country for 2 weeks (the virus incubation period) except for vital services like grocery stores, pharmacies, emergency services, and needed health care including time sensitive care such as cancer treatment.
- No crowding of stores will be allowed. It is not smart that people are storming grocery stores when the open. You need at least 6 feet between you and infected patient and that’s not 100% effective necessarily. It helps though. Traffic into and out of stores will be regulated and no one with a fever will be admitted. Doctor’s offices and hospitals need to have similar practices, so they don’t infect their other patients. My doctor’s office is making every patient wear a mask. I declined my annual physical last Friday, because there is no point to adding to risk at this time.
- Everyone (except those groups mentioned above) self-quarantines with their family. If a family member becomes sick with the virus during the 14 days, the entire family must be quarantined for another 14 days.
- Anyone with typical symptoms including flu-like symptoms which have been said to overlap what is seen with coronavirus, is tested. Patients need a flu and a coronavirus test. Testing asymptomatic patients is not efficient at this time, because you have to test for multiple days to be sure someone is negative.
- After the “Vacation” is over, we test all workers/restaurant goers etc. with non-touch thermometers and exclude anyone with a fever. They should likely all be tested. Same for air, bus, train, etc. travel.
- When we have an abundance of tests, more can be done to test larger groups including contacts, but as said, multiple tests will be required to say they are negative. That may not be practical, but we’ll see.
2. We do something less that my plan but not nothing more. Then this will go on for many more months as infected people slip through, go to work, infect other workers who go home and infect their child, visit their parents and essentially kill them with the virus they pass on…their children go back to school and pass the virus to other child hosts, who take it home… Understood? That scenario will be like Chinese water torture as they call it, especially for US markets.
3. We do nothing more than close down a few theme parks and sports for two weeks. Then we could end up with up to 200,000 dead Americans.
There is huge political risk here for Trump. If he does not make bold moves, it will end his chances for term #2. This is not a partisan comment. It’s reality and due also to the fact that he did not act swiftly other than to close travel from China to the U.S. Whether you love him or not, he will be blamed for the outcome. I said it many days ago. This is his Katrina. He’s doing better now, but needs to do far more.
What would satisfy me that the Bulls are serious?
The Bull Market Health Score this week is Bulls 0.0/Bears 5.0 vs. Bulls 0.0/Bears 5.0 for the Feb 28th close. It’s a 5 point scoring system. It has been 0 for 3 weeks straight.
For each checklist item below, I give you the points scored as Bullish or Bearish. If the number is “Bulls 0.0” that means the Bears score a point.
1. New high? (here I look at large caps alone) Bulls 0.0 Answer: No. Friday was a bounce in a crash. I warned investors here over the last few months that the market was stretched. Few except my loyal readers cared to listen.
2. V*IX trend favorable? (VIX trend is either up, down or undecided and consolidating.) Bulls 0.0 Answer: No. The VIX Game Score is Bulls 0/Bears 7 at a VIX close Friday of 40.11. In the Jan. issue I said: “This level of volatility always ushers in the possibility of “much worse” volatility. Volatility hit a high on Thursday of 77.57 vs. 89.53 in 2008. It’s high enough though! Remember that as volatility falls from here, it does not mean we are back to the races. After around 11-26-08, VIX fell over the time right up to the bottom in early March 2009 at SPX 666ish. A recession was in the way most likely, and it’s going to hit home here. The depth will be determined by our speed of recovery from the virus as well as a fundamental recovery of global economies that were slowing ahead of the virus.
3. AD % Line in an Uptrend short term? (This is a proprietary stat; see base of report.): Bulls 0.0 point. Answer: No. It is in a downtrend despite a Friday bounce. Afterhours on Friday the SPY’s fell a couple of percent by the way.
4. Higher volume on Up Moves? Lower volume on Down moves? (Has to be true for either large caps or for both small and midcaps to be a “Yes.” If discrepant, the Score is 0.5) Bulls 0.0 point. Answer: No. Look at the chart.
5. Is the “U.S. Index Matrix Signal,” as I call it, positive? (To be positive, small and mid caps must be trending up with large caps; if mid and small caps are discrepant with each other the score is 0.5) Bulls 0.0 point. Answer: No. Same as last month’s issue. The small are down 31.1% from their ATH in 2018 and midcaps are down 26.92% from their 2-20-20 ATH (IJH was 210.86; now 154.10)
Graph of the Bull Market Health Score (BMHS)
Note: 1000 = 1 BMHS point on the scale. SPX values are adjusted (by 3000 points) to plot them more easily on the same graph. (That means you should look at the relative changes in the SP500 Index (SPX), not read the values off the Y axis.) BMHS cannot be below zero or above five.
Note that back in the summer of 2019, the market started to rally once the BMHS bottomed out for 4 weeks in a row. We are in week 3.
The lower high in BMHS was the hint that something was wrong with the higher highs being made in Tech and the SP500 Index. That’s what is called a “negative divergence.” The BMHS signal did not confirm the new high.

Bull Market Health Score for 3-13-2020 Close
This Update of the Earnings Picture (see FactSet.com for original data and some great content!) for the S&P 500 Index (see caption) shows the trouble ahead for stocks:
Note that analysts appear to think earnings will be negative for the SP500 in Q1 2020, barely positive in Q2 and they are already bringing down estimates for the second half of the year and for the year.
This drop could be the first whiff we are getting of an oncoming recession.

FactSet Earrnings Data

FactSet Revenue Data in decline for 2020.
Keep up-to-date and read my comments on the current setup during the week at Twitter and StockTwits (links below) where a combined 34,304 investors are following the markets with me…
Follow Me on Twitter® Follow Me on StockTwits®. (real time messages are on StockTwits as always and back on Twitter)
Join the Conversation in the StockTwits “MarketTiming” Room (I’ll publish comments in the room periodically)
I wrote this for the 1-31-20 Issue: “Take a look at the SP500 chart. From before:
“As I warned many weeks ago, if the market keeps pushing above that top long yellow line, there will be eventual payback.” This is the payback…”
My prior buys in QQQ were premature. That’s OK, because the adds were not huge. I traded out of part of the position for a profit, but could have sold the whole position and done better. Last issue I said:
“For now, I’m sticking to that viewpoint unless this turns into a Big Bear Market. (see New Rules, if you haven’t to know what a “Big Bear” is by my rules…) Then I’ll be selling exposure again.”
I pointed out in the last issue that Fed rates cuts do not help stave off a recession. They are merely trying to cushion the blow of a recession.
At the Thursday close we were -26.83% for SPX. I use SP500 Index as my guide for Bull and Bear markets and per my New Rules (HERE) we just by a bit tipped over the line into a Big Bear Market, which is a “Recession Bear Market.” Slowdowns can give you -20% drawdowns as we saw in Dec. 2018.
Recessions are less forgiving, but that is only the case if they are deep. In 1990, which was a -0.6% recession that was relatively brief, the drawdown was only 20%. CNBC claims the MEDIAN (middle of all recessions; not the average) drawdown for recessions is around 28%, but in 2008-2009 the drawdown was 57.7% for the SP500 Index.
Is it going to be that bad? It depends on the trajectory of the virus and the global economy, but I don’t think it’s going to be pretty due to the dislocations we are seeing. Delta cutting 40% of their flights. You get a big increase in unemployment. People stop buying homes. The unemployed buy less. Etc etc etc… Y0u get the picture.
Right now, we don’t know how deep the recession will be and whether the dip in activity will exceed one quarter, which is required definitionally, but regardless, we cannot expect the market to just bounce back to the previously stretched valuations while earnings and revenues are FALLING.
So here’s the plan I will follow and you should only consider it, if you will execute it faithfully. If you sell and are too afraid to rebuy, you will lose money.
- I will sell into the bounces until the virus/economic trajectories are better defined, but I will trade the market by the charts regardless of those two issues. I will lower my exposure on bounces from the current level of about 74% of maximum exposure for a Bull market to 70% of my usual max. exposure for a Bull Market on the bounce, and the amount may depend on the size of the bounce. (That means if you are normally 60% in the market when it’s Bullish, you’d go to 42% – but, of course, decide for yourself and consult your advisor). I you won’t re-buy lower or higher if needed, don’t do anything.
- I will buy the stocks/sectors that do the best in a slowing economy and trade some or all of that exposure on bounces. I bought XLV (healthcare on Thursday when the market had pulled back quite a bit. One buy is up 1.69%. Another buy is up 3.53% as of the close on Friday. It will likely be in the red after the Fed action tonight if the futures stay as they are now.
- I will likely sell some/all of the small amount of IJH exposure I own at the next lower high and keep the XLV. I will sell SPY exposure vs. XLV or individual stocks depending on how they are all acting. My sells will be strategic.I would sell small and midcap exposure in ETFs at the highs. Follow me on social media to see where those spots occur. I sold the last major lower high successfully on 3-03, but could have sold more. We can always learn and do better than we did “last time”…
Don’t become complacent on the big bounces as Trump did on Friday. “Violent delights bring violent ends.” That’s an allusion to a popular show, and it also refers to bounces like the one we saw into the close on Friday that Trump crowed about. Big bounce means a big decline to come in a Bear Market.
Futures are down over 5% as I type because the Fed said it:
1. Lowered Fed Funds to 0.0%-0.25% which is essentially ZERO and it will…
2. Do QE by buying Treasuries up to 500 B and also buying mortgage-backed securities up to 200 B. 700 B in total! Read their release HERE.
Why would the market sell off because the Fed cut rates? It’s the same answer as shared by me after the prior cut of 0.5%. After 3 cuts, the Fed is signalling RECESSION. These actions ON A SUNDAY NIGHT are “CRISIS MOVES,” confirming my analysis above. The Fed knows the economy is headed into a recession with a high degree of probability, and now Trump is praising them for doing the cuts. The market is panicking still.
SP500 Large Cap Index (click chart to enlarge; SPX, SPY):
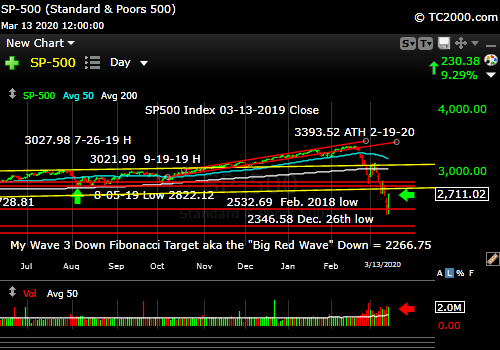
Big Bear Market is here. Will it go away quickly and how much more drawdown will we see?
Now let’s review investor sentiment…
Survey Says!
Sentiment of individual investors (AAII.com) showed a Bull minus Bear percentage spread of -21.57 on 3-11-2020. Sentiment is bad enough to support a bounce, but can easily go 10 points or so lower. What stood out for me was the degree of Bearishness which is fairly extreme. On 8-07-19, when the market was just coming off the low in August, Bears were at 48.20%. On 12-26-18, at the very bottom (intraday) of the SPX, which we have not yet revisited, it was 50.30. Get the idea?
This degree of Bearishness is fairly extreme, but there are still a Bulls to be toppled. The spread should push toward -30% if they are. Near the Great Recession bottom the Bears were at an off the wall 70.27%, which was a convincing washout level. The peak Bull – Bear spread hit -30 and below, peaking at a -51.4%. That is a huge extreme that would only happen after investors have been pummeled by losses for many months, which was the case.
CONCLUSION: Sentiment is fairly negative, but there are still too many Bulls for the situation we are in. There is more downside ahead is what sentiment says. It’s not our main indicator, but it provides context for the charts.
| Bulls | Neutrals | Bears |
| 29.74% | 18.95% | 51.31% |
| Thurs. 12 am CT close to poll | ||
2. U.S. Small Caps Market Timing – Russell 2000 U.S. Small Cap Index (click chart to enlarge; IWM, RUT)
Simple message: Stay out of small and midcaps unless you intend to trade them. You don’t want to own them in Big Bear Markets. We are now in a Big Bear Market until proven otherwise.
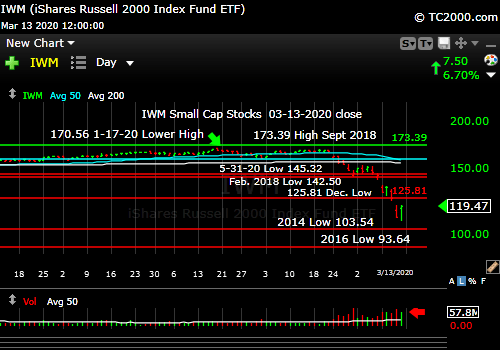
The worst of the bunch.
3. Gold Market Timing (click chart to enlarge; GLD):
Gold broke down in part due to liquidity concerns. Rates fell to zero at the Fed tonight, so gold futures are up 1%, but that is not a very vigorous response. I sold all my GDX right near the lower top and sold my gold just as it was breaking down saving me from several percent in losses. Gold fell significantly (see my stream) in 2008 by over 25% and then rallied before stocks into 2009. It’s not the time to add in my view.
I am keeping only my core GLD exposure, which is now at about 4% of all assets. My remaining gold stock positions consists only of a handful of gold miners that are part of a portfolio picked by an analyst I am testing with a very small amount of money. He’s not doing well, needless to say. It’s a meaningless percentage of my GLD exposure. Thankfully!
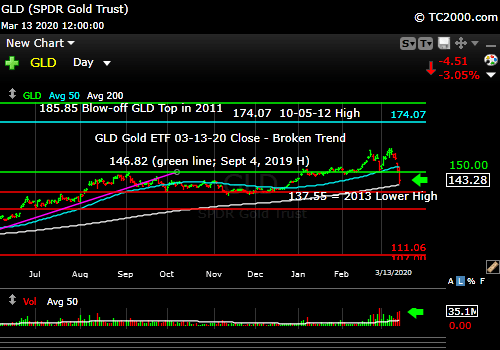
Broken trend. Longer term neutral.
I had suggested keeping a 5% position in gold in the prior issue, but I always reserve the right to change my mind. Gold volatility spiked in a big way and the trend was breaking, so I’m dumped it all as reported on social media in real time. It’s less complicated than people make it.
Being in love with gold permanently is a bad idea except as portfolio insurance against a weak dollar. Let’s see what the dollar does. Global slowing tends to push the dollar up, while the Fed lowering rates should push it down. Which will win? How negative will real rates get if the economy stops to a near crawl? As inflation crashes, real rates drop against falling interest rates. We’ll see, but remember the experience in 2008! The dollar index futures are only down 0.30% today with the market down over 5% (at limit down) and with Fed Funds now at 0.0%-0.25%.
Check out the “Market Signal Summary” below – after you review the following chart…
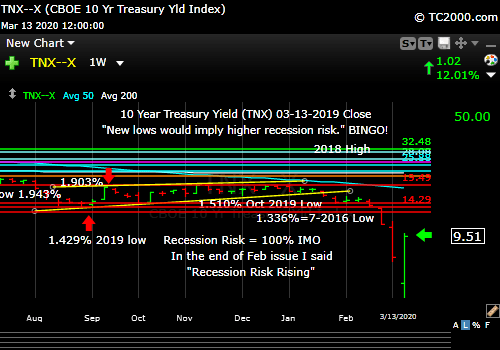
4. Interest Rate Market Timing (10 Year Treasury Yield; click chart to enlarge; TNX, IEF, TLT):
The “Falling Rate Shock” continued Sunday night with the Federal Reserve action. After the Feb. 28th close I wrote…
“Rates were already crashing as of 1-31-2020, and it’s even worse now. This is a recession signal the Federal Reserve should be careful of ignoring.”
“Federal Reserve tools should be used in crisis times, and THEN reversed! They failed to reverse rates when they could and now they have less powder…but there is always the printing press! Ugh!”
QE is the printing press! Look at that bounce Friday, but now? The 10 year Treasury is at 0.677% after the Federal Reserve action tonight.
You have the privilege of loaning the Treasury money at 0.677% WELL below the current inflation rate per the NY Fed “Full Data Set” Underlying Inflation Gauge of 2.3%! You can lose 1.623% per year if you do this unless you are trading Treasuries for a break to “negative rates.” I hope they don’t go there! In the meantime, I’ll stick with cash and other income opportunities when they arise and look safe!
Rate crash with a bounce. It will fall tomorrow though after Fed action on Sunday.
Now let’s review three key market timing signals together….
Do not use these signals as a trading plan. They are rough guidelines. I currently share my actual BUYS and SELLS in as timely a way as possible on social media (links above).
MY MARKET SIGNAL AND TREND SUMMARY for a Further U.S. Stock Market Rally with Real GDP Growth (“Real” means above inflation):
Stock Signal RED for a further U.S. stock market rally with a short term BEARISH and longer term Bearish SP500 Index trend. The stock signal is based on small caps, as they often lead the market down. See above for more. I said last issue Feb. 28th: If the SP500 Index closes below the bottom yellow channel line on my chart, I’ll call the longer term SPX trend Bearish. It did!
Gold Signal NEUTRAL for a further U.S. stock market rally. The Gold Trend is short term BEARISH and longer term Neutral. I am calling it short term Bearish, because of the magnitude of the drop on high volume. GLD’s longer term neutral, but it will be Bearish if it drops below the Oct. to Dec. 2019 lows.
What gold does mostly as I’ve written HERE is follow real interest rates around the world (if you own “gold in dollar terms” you care about U.S. rates most of all). The rest of the world does matter however, including massive buying by central banks.
GUIDE: “Remember GLD is being used as an indicator for the ECONOMY here.” If gold continues to rise, it means the market believes real rates will fall, which in the current context means the global economy is slowing. That would ultimately hurt U.S. stocks.
Rate Signal RED for a further stock market rally with a longer term BEARISH and short term Bearish 10 Year Yield Trend. (Remember: higher rates mean lower bond and Treasury prices and vice versa). Rates are collapsing to all time lows! That is still Bearish for rates and says U.S. recession risk is closing on 100% as said above.
Thank you for reading. Would you please leave your comments below where it says “Leave a Reply”… or ask a question if you like…
Pay it forward by sending the link to MarketTiming.Blog (that link will immediately connect them to this webpage) to a relative or friend. Thanks for doing that.
Be sure to visit the website for more general investing knowledge at:
Standard Disclaimer: It’s your money and your decision as to how to invest it.
I thank Worden Brothers for the charting system I use to post these charts. If you want to know more about the charting system I use every day, contact me. It makes it much easier to follow along with me if you can see the charts and manipulate them on your own computer. It’s a great investment to have an excellent charting system.
Note: I’ve updated my criteria for the equity signal for a further U.S. stock market rally to the following: GREEN = Bullish, YELLOW = Neutral, RED = Bearish. In other words, the colors tell you whether the signal supports the stock rally or not, while the Bullish, Neutral, and Bearish designations are about the trend.
A BEARISH trend signal does not mean we should not buy. A BULLISH trend signal does not mean you cannot sell some exposure. It depends on what is going on in the economy and how oversold/overbought the market is at a given point whether the Bearish signal is to be sold or bought, sold on the next bounce, etc. and whether a Bullish signal is to be bought or if profits should be taken. A NEUTRAL trend signal does not mean the end of the Bull or Bear. It means to wait and look for possible subsequent entry points within the existing trend, Bull or Bear, but preserve capital if the entry fails. Our strong intention is to buy low and sell high. By the way, I will keep showing the prior orange “Trigger lines” in the IWM and GLD charts for now as reference points only; they have historical value for us from the post-2016 election period.
Copyright © 2020 By Wall Street Sun and Storm Report, LLC All rights reserved.

Excellent market analysis David, thanks!
Thank you Charles!