A Market Timing Report based on the February 28, 2020 close…
The context for the charts will be addressed on social media during the week…be sure to read those posts as well, or you’ll miss at least half of the picture.
NOTE: I am publishing just after the last Friday/Holiday close of the week each month, so if the last Friday precedes the end of the month, I will publish on that corresponding weekend. (for example, posts will be on 2-29, 3-28, 4-25, 5-30, 6-27 or the day after, meaning on Saturday most likely, but at the latest by the day prior to the next week’s open, and in case of a holiday, meaning by Monday evening.) I may publish earlier each month if the market action requires it…
If you want to be alerted to each post, please subscribe via WordPress, and you’ll receive an email each time I publish here… Thanks and feel free to comment or leave a question below…
1. SP500 Index Market Timing (S&P 500 Index®; SPY, SPX):
In the last issue I asked, “Why are we losing some of the previous stretch in the SP500 Index that I’ve been warning would happen? The Coronavirus COVID-19 is the excuse, not the cause of the drawdown.” The same truth applies. Earnings have been flat for a year and despite that investors have bid stocks up above the reality of those earnings. Investors now see supply disruptions, work stoppages, and permanent loss of some revenue such as travel related revenue. Restaurants also fit the category of businesses that will permanently lose revenue if too many Americans mindlessly fall into fear of a pandemic.
Why do I say “mindlessly”? Because the stats I just published HERE and HERE show the number of active cases of the virus IS DECLINING NOT RISING! (unless it changes this evening when I run the numbers, which I’ve done daily since the virus outbreak began at the end of January (the first big spike in the total case number). It’s better to stick with the available data than to speculate wildly about unreported cases. Of course, there are cases not being reported, but those would REDUCE the actual mortality rate, not increase it! Yes, we must be vigilant, but preparation has nothing to do with fear as I said a month ago.
From Last Month: “I recommend against fear-based thinking. Look at the facts and learn how to prevent the spread of Coronavirus, and retweet my messages and you’ll help. (I don’t need your retweets, but the world clearly does… Please pay it forward.)” Only a few of you did retweet my messages, so please pitch in. “Liking” doesn’t help nearly as much though I appreciate it. If you want to help, please also retweet my messages. Remember. Fear is already viral. Please help me get “preparation and the truth” to go viral.
Health Issues around Coronavirus (COVID-19) for those interested (a reminder – in addition to being a market analyst, I am a physician, former Director of Surgical Pathology at Stony Brook Medical School, and a trained molecular biologist who studied the way one virus called Gibbon Ape Leukemia Virus caused lymphomas in those apes. At Penn and Stanford along with Jerry Crabtree and others providing great financial support and technical assistance, I discovered the control region of the Interleukin-2 (IL-2) gene that drives T-cell growth and is susceptible to cyclosporin and other similar immunosuppressants, as well as NF-AT (along with Jeng-Peng Shaw) that turns on the IL-2 gene during the immune response as well as forming part of the nervous system and all vertebrate heart valves).
I’ve been sharing that fear directly impairs your immune system if you engage in it, and the one thing we know about the virus is that the death rate is much, much higher up to around 15% in debilitated patients particularly the elderly and those with pulmonary and cardiac conditions. The elderly have weaker immune systems in general. That makes them more susceptible to infection. Being older adds a risk of not being able to recover as the body is less resilient when challenged than is the case for a young person.
Fear suppresses your immunity to viruses and makes you more likely to develop a serious case. If you fall in those at risk categories, please don’t worry. That will only make things worse. Be prepared. If you have serious lung disease for example, stay away from sick people as best you can. Stay well nourished. Get your sleep. Wash your hands after returning from shopping. Politely decline to shake people’s hands unless you are very aware of your own movements. If you contact the virus with your fingers and then touch any upper respiratory mucous membrane (eyes, nose, mouth) you risk infection of your lower respiratory tract with Coronavirus, where the virus seems to find its home. (If you have significant upper respiratory symptoms that are like a typical cold, you are very UNLIKELY to have the virus, but you should still be tested for now to be safe. Coronavirus causes a lower respiratory infection vs. colds which love the upper airways.
The good news for younger people is that the mortality rate for them is much lower, but as Dr. Fauci pointed out, don’t be surprised if an occasional younger patient dies, so still take any respiratory infection seriously and get tested for BOTH Influenza as well as Coronavirus (currently recommended per Sec. Azar’s comments today on ABC News).
What about Election Risk this week? Thankfully, Joe Biden had a big win in South Carolina on Saturday. I say thankfully, because as much as Trump thinks he can beat Sanders, he may not. Sanders may “Out Trump Trump” as I call it, and then we could decend into socialism. Yes, I realize some of our existing programs are “socialist,” but Sanders goes off the deep end.
Trump having his followers vote for Sanders because he thinks he’s the weaker choice is truly pathetic/sleazy, and as said, it could backfire horribly. IF Sanders’ socialism is not defeated, the markets will have a major fit that will make this past week look like a blip! Remember that Sanders like Trump appeals to the disaffected in our country, and he is offering them “Free Everything” as I call it. The Biden healthcare plan is much more reasonable IMO, and his changes to tax policy will balance the budget to a greater extent and favor the middle class. I agree with that because the middle class has not gotten a pay increase over inflation for decades.
What would satisfy me that the Bulls are serious?
The Bull Market Health Score this week is Bulls 0.0/Bears 5.0 vs. Bulls 0.0/Bears 5.0 for the Jan. 31 close. It’s a 5 point scoring system.
For each checklist item below, I give you the points scored as Bullish or Bearish. If the number is “Bulls 0.0” that means the Bears score a point.
1. New high? (here I look at large caps alone) Bulls 0.0 Answer: No. Last time I warned: “Stretched markets invariably correct and simply look for bad news to do so.” That’s what is happening. Price is falling to come into alignment with earnings with the added fear that earnings will continue to fall for one or more quarters.
The market hates uncertainty and this is one of those uncertain times. It’s not uncertain that we’ll beat the virus, but how well we face it off in this country could impact the near term performance of our equity market. Then we also have impacts on multinationals from pandemics in various other countries like Italy, South Korea, and possibly Japan. They need to quickly ID cases, diagnose them molecularly, and quarantine all contacts of infected patients.
2. V*IX trend favorable? (VIX trend is either up, down or undecided and consolidating.) Bulls 0.0 Answer: No. The VIX Game Score is Bulls 0/Bears 7 at a VIX close Friday of 40.11. In the prior issue I said: “This level of volatility always ushers in the possibility of “much worse” volatility. Volatility is trending UP. Closing above the Dec. high is a distinct negative.” We have had yet another “Volatility Volcano” as I called it back in Feb. 2018m roughly at levels seen both during the 2015 Flash Crash and the Feb. 2016 volatility spike that caused a lot of people shorting volatility at the time to blow up their accounts (with VIX ETFs).
This level of volatility is considered “uninvestable” by some money managers/hedge funds. I have seen newsletters out this past weekend saying to sell stocks. That could mean more waves of selling. Recognize that and buy in stages if you have cash. I’ve made some purchases already and together they are down 3.48% after being down much more prior to the Fed statement that they would intervene as necessary to support the markets (see my social media feed please; links are below). The market was up afterhours by around a percent, so perhaps my loss will be down to about 2.5% or so by Monday. It depends on the news flow really. Futures are down about 1% now despite that afterhours rally, so we’ll see…
3. AD % Line in an Uptrend short term? (This is a proprietary stat; see base of report.): Bulls 0.0 point. Answer: No. Stocks did bounce as I predicted they would in the last issue based on this parameter, but then took it on the chin as the fear about further global slowing erupted into the “Volatility Volcano.”
4. Higher volume on Up Moves? Lower volume on Down moves? (Has to be true for either large caps or for both small and midcaps to be a “Yes.” If discrepant, the Score is 0.5) Bulls 0.0 point. Answer: No. I said as of the Jan. 31st close: “We are definitively in a 3rd wave down which is the largest wave. Volume went up BIG on Friday on the down move. That was true across all ‘caps.'” This was prophetic perhaps, although the market did rally for about 8 trading days before it started crashing in 3.0% to 4.5% per day drops.
Volume on the downside has been enormous, which is not a good sign at the start. But it can lead to a bounce at a minimum, once the market is stretched to the downside, which is why I added some exposure, while holding back some cash. Volume on Friday EXCEEDED the volume back in December 2018, when the market was down 20% from top to bottom by the 12-24-18 close, and then it bounced hard on the 26th. It was up 4.96% that day, and it still could have been bought then! That closing price was not achieved again on the next small pullback on 1-3-19 of 2.48%.
5. Is the “U.S. Index Matrix Signal,” as I call it, positive? (To be positive, small and mid caps must be trending up with large caps; if mid and small caps are discrepant with each other the score is 0.5) Bulls 0.0 point. Answer: No. Yikes, no way! Small cap and mid cap stocks are suffering as usual during these highly correlated market declines, where investors start dumping everything, including utilities and gold stocks that had been working previously. Small and midcaps make you the most on the way up (not always, but over time, generally) and lose you the most on the way down.
Graph of the Bull Market Health Score (BMHS)
Note: 1000 = 1 BMHS point on the scale. SPX values are adjusted (by 3000 points) to plot them more easily on the same graph. (That means you should look at the relative changes in the SP500 Index (SPX), not read the values off the Y axis.)

The lower high in the BMHS formed as of the prior Friday hit home this week. The market close was 12.9% from the ATH.
Note how my BMHS had formed a lower high as of last Friday and then crashed to a value of zero this week. The lower high BMHS on 7-26-19 also did not work out. We then saw the August drop on the trade impasse with China.
Last month’s issue: “The minimum 3rd wave bottom if we go by the Fibonacci numbers would be 3127. Remember, if there are 5 waves the 5th wave can descend below the end of that 3rd wave low. The upper yellow line on the chart below, or the middle of the channel formed by the two yellow lines are also reasonable targets.” We got to 2954.22 by the close after hitting a low of 2855.84 earlier in the day. That was pretty close to that lower yellow channel line. That alone says “Maybe enough!” That is a 1000 point bounce stimulated by Powell’s statement. When I saw how quick the reaction was to his statement, I added again on Friday and messaged that to you via social media…
STILL HOLDS: “I don’t set price targets per se as many of you know. I just look to see WHERE the targets are. Then I evaluate the market after each move to decide whether it’s worth a buy.
Update of Earnings Picture (see FactSet.com for original data and some great content!) for the S&P 500 Index (see caption):

Note earnings estimates are falling for the next two quarters. (Source FactSet.com Go there for more!)
Note that analysts appear to think earnings will be hit more in the next two reported quarters (Q1 and Q2) than later in the year. Oddly revenue estimates for Q4 declined the most of any quarter this week. See my note on analyst revenue estimates declining for Q4 2020 in the caption below…

The biggest drop in revenue estimates this week was for Q4 2020, which is the biggest selling season for retail.
Keep up-to-date and read my comments on the current setup during the week at Twitter and StockTwits (links below) where a combined 34,304 investors are following the markets with me…
Follow Me on Twitter® Follow Me on StockTwits®. (real time messages are on StockTwits as always and back on Twitter)
Join the Conversation in the StockTwits “MarketTiming” Room (I’ll publish comments in the room periodically)
I wrote this for the 1-31-20 Issue: “Take a look at the SP500 chart. From before: “As I warned many weeks ago, if the market keeps pushing above that top long yellow line, there will be eventual payback.” This is the payback…”
The market has “dropped enough,” IF analysts projections are not too optimistic. Of course, given the fact they cannot know what will happen for sure in the U.S. in the Coronavirus trajectory, predicting earnings becomes problematic. For this reason, I’d stick with companies that don’t lose customer business permanently. For example, you won’t be going to the a restaurant four times a month if you normally eat there just once a month, just because you stayed home for 3 months to avoid the virus. The restaurants IF they will be impacted by the virus in the U.S., as Starbucks was in China, will permanently LOSE some business. Starbucks has gone back to business we are told and the overall hit may not be that bad, but that is something investors will be looking at in the coming months.
I’d tend to favor companies whose customers will come back later and do the same business, such as buy a new software program, provided the stocks of those companies are not too overvalued vs. the market. If they are still overpriced, they could still sell off in an overall contraction of GDP and market sell off.
So guess what? I decided to buy the QQQ instead of picking individual companies. If you can figure out the prior equations I presented, by all means, select individual companies. The risk of QQQ is in the tech component that could be hit further on a valuation basis, if the slowdown is more protracted. BUT I don’t believe the Bull market is over, which means tech companies will ultimately reach higher highs than they already have. For now, I’m sticking to that viewpoint unless this turns into a Big Bear Market. (see New Rules, if you haven’t to know what a “Big Bear” is by my rules…) Then I’ll be selling exposure again.
Here is the biggest caveat around Fed rate cuts: As former Federal Reserve insider Danielle DiMartino Booth has shared (see @DiMartinoBooth on Twitter), a fourth Fed rate cut can actually lead to more LOSSES in the US equity market, because it may indicate the Fed’s belief there is a recession on the way. Could I tell you a secret? Recessions are Bull Market killers (see New Rules link above – critical to read). That means ANY further rate cuts had better get us to 1. Better economic numbers relatively quickly (if unemployment, for ex., keeps rising after rate cuts, that would be a bad sign) 2. Calmer markets (lower volatility not continued high volatility) 3. Eventually return to slowing RISING rates and slowly rising inflation (from disinflation/deflation), which is always the case when economic slowing turns to economic acceleration.
Note in the chart below that the prior double yellow line channel held the decline on Friday. The lower yellow line is 2828 or so. We got to 2856. Close enough. That does not mean the market will not keep selling off, but generally selling occurs in waves, and to reach a low 15.84% off the prior high in just 5 days is extraordinary – in fact it was reported as a record in speed of decline. The risk of a bounce has gone up, especially with the Federal Reserve making noise about being helpful as needed in the Coronavirus crisis.
Let’s turn to my so-called “stretch indicators.” A few notes on the methodology first… Note that the maximum value of the Dog Stock groups are determined using the extremes reached in Dec. 2018. Those levels are called “100%.” The Bull Stock Group progress is judged by the percentage falls vs. the highs they achieved in December 2018, so even back then, the extremes did not quite reach 100%. The first bars are based on the intraday maximum/minimum values and the 2nd bars are based on the closing values on 2-28-20.
So what do my stretch indicators say? The answers they give to the question “Are we at a bottom yet?” are a bit mixed, though the most stretched group (#2 in the graph below) has shrunk to nearly the same extent they did back in December 2018. The low then was 98.20% from the high, and intraday on 2-28-20, it reached a low of 97.15% (% drop from the December high). You can see that #8 nearly hit 80% at the climax low on Friday, while two indicators fell shy of December levels. Let’s summarize it by saying that 7/9 indicators were within about 80% or better to their December targets. The caveat? This decline was more vicious in temporal terms than the December drop.
Again, what the numbers did say to me was that it was a reasonable place to add some exposure, whether it turns out to be right on an immediate basis or not. I’ve bought “early” before and made great money, but if I’m wrong, I have a written plan on how to get out and I’ll be flagging that on social media if I do! No one can tell you exactly how far markets will correct. They are all just guesses. But what I do know is that the falls we have seen COULD be enough, so I simply had to buy some exposure. “Had to” in order to be disciplined about getting low prices on stock exposure.
All you can do is add at certain spots and cut your losses at others. The key is not whether the losses go to 20% and then we bounce. The key is whether this is a Mini Bear Market (see New Rules!) or a Big Bear Market. They are completely different in behavior. Mini Bears lead to new highs much sooner. They don’t kill Bull Markets. Big Bears are the death of Bull Markets.

2020-02-28-Bull and Dog Stock Groups vs. their Dec. 2018 Maximum Values
SP500 Large Cap Index (click chart to enlarge; SPX, SPY):
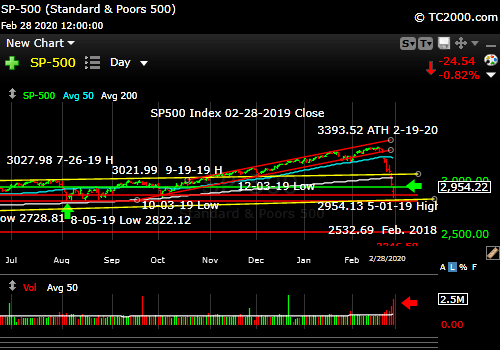
Big red wave along with a Volatility Volcano. (market closed at the green arrow)
Now let’s review investor sentiment…
Survey Says!
Sentiment of individual investors (AAII.com) showed a Bull minus Bear percentage spread of -8.70% vs -4.88% on 1-29-2020. There is room in both direction, but we are definitely not at a “selling climax” level. The limitation is the poll, which is done only once a week (poll ends Weds midnight). I would say investors were too Bullish still after Wednesday’s close.
| Bulls | Neutrals | Bears |
| 30.43% | 30.43% | 39.13% |
| Thurs. 12 am CT close to poll | ||
2. U.S. Small Caps Market Timing – Russell 2000 U.S. Small Cap Index (click chart to enlarge; IWM, RUT)
Last issue: “You can see the 3rd wave forming here too and that my comments on social media about small caps leading the way down were predictive.” That was not entirely right, because the market bounced and then failed in a big way.
Small caps have reached the lows of 2019 as you see on the chart. They “should be able to” bounce, but if they don’t, do not expect the large caps to bounce either! My target a few days ago on social media were those 2019 lows (145ish)…(who would’ve thunk it! It’s a huge drop.) NOTE: There should be an arrow by the closing price which is shown as 146.33.

Small caps look like they’ve found a bottom…least the prior bottom!
3. Gold Market Timing (click chart to enlarge; GLD):
Gold started to get a bit exponential in its rise, so if you took profits prior to Friday’s drop, congratulations! I’d find spots to add back though, because if the Federal Reserve is going to ease, the dollar will fall, and rates are likely to fall further as well unless inflation starts building steam, but the latter is not in the cards in a slowing global economy. Further, if inflation were to start rising quickly, gold will offer protection. So far, the pullback is OK, though the magnitude is something to take note of. Big swings often bring more big swings.
Still, with the Fed on the way, investors should be adding more gold, not reducing their exposure IMO. There may also be some fear that rates will back up a bit, since THEY are now stretched to the downside. Imminent Fed action may prevent that however. Taken together I’m not interested in taking off exposure from my usual 5% level at this point. Trading out of part of it when things got nutty would have worked however, so remember that as a possibility for next time. That works IF you buy it back lower, which is what I coined “Passive Shorting.” Read about it HERE…
I’m leaving this here this week… “Over the intermediate term: Gold loves low rates, so we’ll have to monitor the recovery of rates and take some profits at some point.”
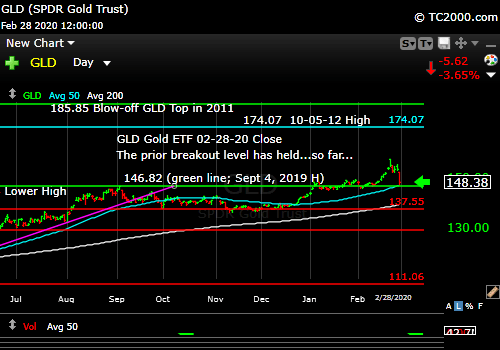
Gold gave up its stretch too, which often happens when liquidity becomes the theme.
Check out the “Market Signal Summary” below – after you review the following chart…
4. Interest Rate Market Timing (10 Year Treasury Yield; click chart to enlarge; TNX, IEF, TLT):
I used to call these “Negative Rate Shocks” but I’m changing that to “Falling Rate Shocks.” Rates were already crashing as of 1-31-2020, and it’s even worse now. This is a recession signal the Federal Reserve should be careful of ignoring. They should in fact act quickly, because they are too far behind the Treasury and bond markets at this point. Sometimes President Trump is right, although his consistent statements such as “I love debt,” do not comfort me, because with that attitude over the long term, we will enter a crisis in which we could lose our reserve currency status to China for example. That would be disastrous for our equity market, not to mention the devastating losses in fixed income and the financial collapse of insurance companies that would follow.
Federal Reserve tools should be used in crisis times, and THEN reversed! They failed to reverse rates when they could and now they have less powder…but there is always the printing press! Ugh!
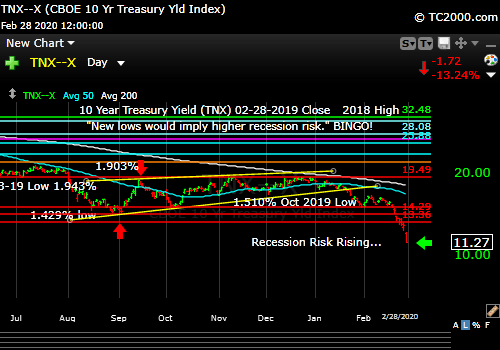
Falling Rate Shock!
Now let’s review three key market timing signals together….
Do not use these signals as a trading plan. They are rough guidelines. I currently share my actual BUYS and SELLS in as timely a way as possible on social media (links above).
MY MARKET SIGNAL AND TREND SUMMARY for a Further U.S. Stock Market Rally with Real GDP Growth (“Real” means above inflation):
Stock Signal RED for a further U.S. stock market rally with a short term BEARISH and longer term Bullish SP500 Index trend. The stock signal is based on small caps, as they often lead the market down. See above for more. If the SP500 Index closes below the bottom yellow channel line on my chart, I’ll call the longer term SPX trend Bearish.
Gold Signal RED for a further U.S. stock market rally. The Gold Trend is short term BEARISH and longer term Bullish. I am calling it short term Bearish, because of the magnitude of the drop on high volume. If you “buy some here,” be willing to “buy some there.” Higher or lower!
What gold does mostly as I’ve written HERE is follow real interest rates around the world (if you own “gold in dollar terms” you care about U.S. rates most of all). The rest of the world does matter however, including massive buying by central banks.
GUIDE: “Remember GLD is being used as an indicator for the ECONOMY here.” If gold continues to rise, it means the market believes real rates will fall, which in the current context means the global economy is slowing. That would ultimately hurt U.S. stocks.
Rate Signal RED for a further stock market rally with a longer term BEARISH and short term Bearish 10 Year Yield Trend. (Remember: higher rates mean lower bond and Treasury prices and vice versa). Rates are collapsing to all time lows! That is still Bearish for rates and says U.S. recession risk is rising.
Thank you for reading. Would you please leave your comments below where it says “Leave a Reply”… or ask a question if you like…
Pay it forward by sending the link to MarketTiming.Blog (that link will immediately connect them to this webpage) to a relative or friend. Thanks for doing that.
Be sure to visit the website for more general investing knowledge at:
Standard Disclaimer: It’s your money and your decision as to how to invest it.
I thank Worden Brothers for the charting system I use to post these charts. If you want to know more about the charting system I use every day, contact me. It makes it much easier to follow along with me if you can see the charts and manipulate them on your own computer. It’s a great investment to have an excellent charting system.
Note: I’ve updated my criteria for the equity signal for a further U.S. stock market rally to the following: GREEN = Bullish, YELLOW = Neutral, RED = Bearish. In other words, the colors tell you whether the signal supports the stock rally or not, while the Bullish, Neutral, and Bearish designations are about the trend.
A BEARISH trend signal does not mean we should not buy. A BULLISH trend signal does not mean you cannot sell some exposure. It depends on what is going on in the economy and how oversold/overbought the market is at a given point whether the Bearish signal is to be sold or bought, sold on the next bounce, etc. and whether a Bullish signal is to be bought or if profits should be taken. A NEUTRAL trend signal does not mean the end of the Bull or Bear. It means to wait and look for possible subsequent entry points within the existing trend, Bull or Bear, but preserve capital if the entry fails. Our strong intention is to buy low and sell high. By the way, I will keep showing the prior orange “Trigger lines” in the IWM and GLD charts for now as reference points only; they have historical value for us from the post-2016 election period.
Copyright © 2020 By Wall Street Sun and Storm Report, LLC All rights reserved.
