A Market Timing Report based on the September 18th, 2020 close…
The context for the market timing charts are addressed on social media during the week (links below), so be sure to read those posts as well, or you’ll miss at least half of the picture . I would review the post three posts back HERE, if you have not yet read it, as it is the ongoing thesis of this earnings season – this is a “BullBear Market” with big winners and equally big losers.
This month, I’m showing you what I am seeing at the markets, and noting key conclusions, and the rest is on social media…(links below)
UPDATE 9-21-20: The market looks like it IS tipping over this a.m., and I will be taking action after the open depending on what I see. Keep reading to get a sense of the set-up for further downside…vs. a recovery in the market…
Let’s start by looking at how strong the Bull is… The Bull Market Health Score (BMHS) Update: I describe how I arrive at the score (HERE).
The market has pulled back and is weak at the moment. The BMHS is low enough to allow for a bounce, and my 20 indicator panel is weak as well with possible downside and room for a bounce. The broken charts of FB, AMZN, AAPL, NFLX, GOOGL, and MSFT, the FAANGM stocks are a warning of more weakness ahead. The shortest term indicators also say there is room for a bounce and room for more downside. Trade the direction of the next move for SPX.
The close Friday was imperfect. Far better, would have been holding up above the 9-08 SPX low, but holding up above the 9-11 low of the SP500 Index COULD be enough. The QQQ is weaker, having closed below the 9-11 low, but only by 0.03 points. It was also a close just above the prior day’s low.
I explained how to look at the discrepancies of weakness across indices HERE.

Bull Market Health Score
1. SP500 Index Market Timing (S&P 500 Index®; SPY, SPX):
Let’s catch up on SP500 Index Earnings and Revenue projections and then look at the current SPX chart… The data are through 8-7-20 (because the author is away for two weeks of vacation). 89% of SPX companies had reported results to that point.
See FactSet.com for original data and some great content.
They are expecting a relative recovery next year, but it may not come until the expected vaccine is fully deployed and working, which could be delayed until late Q2 of 2021 or later. Right now analysts are expecting a big bounce vs. last year’s numbers in Q1 2021. It had better happen… They are buying stocks AHEAD of better times, which entails risk of disappointment. It is so far a V-market, without a V-recovery and the mismatch could further reprice US/global equities.

FactSet Earnings Data as pf 9-18-2020

SPX Revenue Data via FactSet as of 9-18-2020.
Keep up-to-date and read my comments on the current setup during the week at Twitter and StockTwits (links below) where a combined 34,571 investors are following the markets with me…
Follow Me on Twitter® Follow Me on StockTwits®. (real time messages are on StockTwits as always and back on Twitter)
Join the Conversation in the StockTwits “MarketTiming” Room (I’ll publish comments in the room periodically.)
SP500 Large Cap Index (click chart to enlarge; SPX, SPY): That base must hold or we could start to complete Wave 3 of 5 (the biggest wave in a drawdown in Fibonacci terms) or at least a second leg in an A-B-C wave down (Down – Up – Down).
UPDATE at 10:21 am: The target for a 3rd Red Wave down predicted by Fibonacci would be 3007, which is very close to the 6-29-2020 low. A Wave C down equal to the first wave down, Wave A, would be a target of 3136.71.
Remember these are simply estimates of future damage and are guesses at best, but they inform whether there is “time to sell” or not. If we were already close to the target, selling would make less sense. I’m selling incrementally because we’ve breached an important level that entails another 7.33% downside from 3245 for the first target of 3007.

Market timing the SP500 Index (SPY, SPX) as of 9-28-2020
Now let’s review investor sentiment…
Survey Says!
Sentiment of individual investors (AAII.com) showed a Bull minus Bear percentage spread of -8.37% on 8-19-20, which was the 30th week of a negative sentiment spread! That is astounding and I analyzed the subsequent market behavior after such long runs of negative sentiment in detail three issues back (see link at top or to upper right). This means we are not yet at a top. The demographics of AAII membership is older, but they have considerable net worth on average. Once they join the party, we will know it’s “getting late,” and time to reduce exposure much more dramatically. That said, I’ll be following the market today, not AAII data. What the market does takes precedence over other inputs like that.
The break off a very stretched market top had me take down my exposure on 9-3-20, but then add some of that back on the QQQ pullback. I still hold that QQQ exposure, while I’ve taken profits in a number of individual stocks (or reduced the positions to zero in some cases) after the market bounced. I noted my recent exposure level on social media (see links above).
| Bulls | Neutrals | Bears |
| 32.02% | 27.59% | 40.39% |
| Thurs. 12 am CT close to poll | ||
2. U.S. Small Caps Market Timing – Russell 2000 U.S. Small Cap Index (click chart to enlarge; IWM, RUT)
I’ll keep this from last time: Small caps are higher risk, so watch your stops, as any downturn would be amplified in them.

Market timing the U.S Small Cap Index (IWM, RUT).
3. Gold Market Timing (click chart to enlarge; GLD): It’s just up off support. No important breach yet. If rates break out, it’s possible gold will break, unless inflation is allowed to rise out of control by a Fed that keeps rates artificially low, but if they fall with further economic slowing, gold should do fine. Google “When Does Gold Shine and When Does It Decline” with the quotes. Gold may decline with stocks of course as it has before when liquidity becomes an issue. When that happened before it rallied ahead of stocks. Reduce your exposure to what you are comfortable with if it breaks the recent lows.
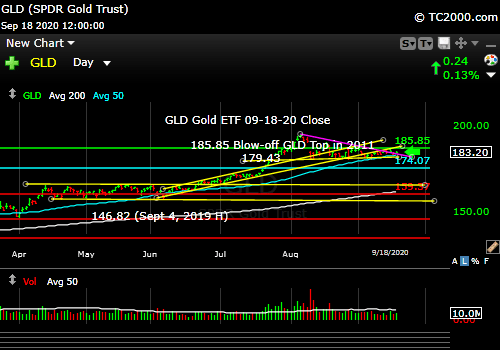
Market timing the gold ETF (GLD). Just up off support.
Check out the “Market Signal Summary” below – after you review the following chart…
4. Interest Rate Market Timing (10 Year Treasury Yield; click chart to enlarge; TNX, IEF, TLT): The Fed is working hard to keep rates down as the economy continues to be under pressure during the COVID-19 pandemic. I added TLT (longer duration US Treasuries) last week as a hedge to this economic downside. I continue to hold IVOL and some muni exposure.
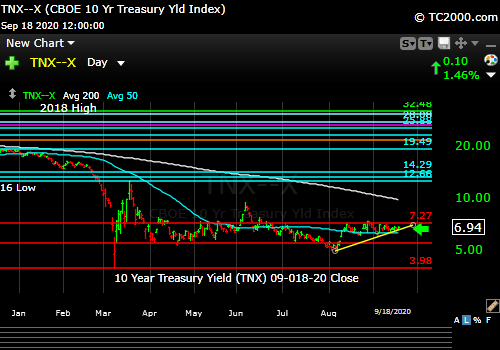
Rates range-bound.
Now let’s review three key market timing signals together….
Do not use these signals as a trading plan. They are rough guidelines. I currently share my actual BUYS and SELLS in as timely a way as possible on social media (links above).
MY MARKET SIGNAL AND TREND SUMMARY for a Further U.S. Stock Market Rally with Real GDP Growth (“Real” means above inflation):
Stock Signal NEUTRAL for a further U.S. stock market rally with a short term BEARISH and longer term Bullish SP500 Index trend. The small caps determine the stock signal. The small cap signals are pulling back off the most recent high. I would have preferred to see a hold above the 9-08 low for SPX, but holding the 9-11 low COULD be enough. The breakdown in leaders like #FAANGM is a problem however due to their dominance.
Gold Signal GREEN for a further U.S. stock market rally. The Gold Trend is short term NEUTRAL and longer term Bullish. Gold can RISE with stocks when real rates are falling, and the dollar is falling. If the dollar gains significant strength, that will hurt both stocks and gold in the near term. Watch the U.S. dollar. And keep in mind that in a financial panic the dollar and gold can rise together. In liquidity crunches (which the Fed is supposed to prevent) gold can drop with everything else but the US dollar.
What gold does mostly as I’ve written HERE is follow real interest rates around the world (if you own “gold in dollar terms” you care about U.S. rates most of all). The rest of the world does matter however, including massive buying by central banks.
GUIDE: “Remember GLD is being used as an indicator for the ECONOMY here.” If gold continues to rise again, it means the market believes real rates are going to fall or stay negative for a period of time. Investors tend to stay out of gold particularly when stocks are doing well as they provide a higher real return.
Rate Signal: As long as rates stay within a relatively low range, the signals are not as valuable when the Fed is manipulating them. The Rate signal on a non-manipulated basis would be NEUTRAL for a further stock market rally with a short term NEUTRAL and longer term BEARISH 10 Year Yield Trend. (Remember: higher rates mean lower bond and Treasury prices and vice versa). If rates crash to new lows, the market will not likely behave very well!
Thank you for reading. Would you please leave your comments below where it says “Leave a reply”… or ask a question if you like…
Pay it forward by sending the link to MarketTiming.Blog (that link will immediately connect them to this webpage) to a relative or friend. Thanks for doing that.
Be sure to visit the website for more general investing knowledge at:
Standard Disclaimer: It’s your money and your decision as to how to invest it.
I thank Worden Brothers for the charting system I use to post these charts. If you want to know more about the charting system I use every day, contact me. It makes it much easier to follow along with me if you can see the charts and manipulate them on your own computer. It’s a great investment to have an excellent charting system.
Note: I’ve updated my criteria for the equity signal for a further U.S. stock market rally to the following: GREEN = Bullish, YELLOW = Neutral, RED = Bearish. In other words, the colors tell you whether the signal supports the stock rally or not, while the Bullish, Neutral, and Bearish designations are about the trend.
A BEARISH trend signal does not mean we should not buy. A BULLISH trend signal does not mean you cannot sell some exposure. It depends on what is going on in the economy and how oversold/overbought the market is at a given point whether the Bearish signal is to be sold or bought, sold on the next bounce, etc. and whether a Bullish signal is to be bought or if profits should be taken. A NEUTRAL trend signal does not mean the end of the Bull or Bear. It means to wait and look for possible subsequent entry points within the existing trend, Bull or Bear, but preserve capital if the entry fails. Our strong intention is to buy low and sell high. By the way, I will keep showing the prior orange “Trigger lines” in the IWM and GLD charts for now as reference points only; they have historical value for us from the post-2016 election period.
Copyright © 2020 By Wall Street Sun and Storm Report, LLC All rights reserved.
