A Market Timing Report based on the October 16th, 2020 close…
The context for the market timing charts are addressed on social media during the week (links below), so be sure to read those posts as well, or you’ll miss at least half of the picture . I would review the post three posts back HERE, if you have not yet read it, as it is the ongoing thesis of this earnings season – this is a “BullBear Market” with big winners and equally big losers.
This month, I’m showing you what I am seeing at the markets, and noting key conclusions, and the rest is on social media…(links below)
10-25-2020 COVID-19 Update: The failure to contain COVID-19 will likely determine both the outcome of the U.S. election generate market timing signals in the near term. Both Total and Active Case numbers are on the rise again in the US as you can see the new recent highs coming up off the recent lows, which is evident in both the raw numbers (blue lines) as well as the 5-day moving averages (orange lines). What I am plotting is the rate of change from day to day. A rising line means an acceleration is occurring (cases are not just still showing up, they are showing up in greater and greater numbers)…

2020-10-24-US COVID19 Day-Over-Day Inc Total Case %-Recent-5 Day MAV

Data analyzed above are from Worldometer COVID-19 Data
Back to the most recent brief…
Let’s start by looking at how strong the Bull is… The Bull Market Health Score (BMHS) Update: I describe how I arrive at the score (HERE).
The market is still below the prior high, but was climbing through Friday. Note however, that the score declined, which is a negative, particularly after making a lower high at 4.0. This indicator by itself indicates further downside in my view. At a minimum, it suggests any immediate gains from here will be lost in a period of chop.

Bull Market Health Score for 10-16-2020 Close
1. SP500 Index Market Timing (S&P 500 Index®; SPY, SPX):
Let’s look at where we are first, and then discuss where we’re going…
SP500 Large Cap Index (click chart to enlarge; SPX, SPY):
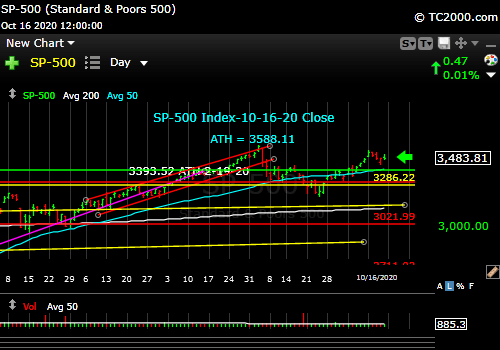
Trend is still up, but we also have a lower high to overcome.
The market is forming a lower high, but the Bulls could still overcome and void it, which could send the market back to the prior ATH or higher. With coronavirus cases rise rapidly in the US and in Europe, there is reason to see “trouble” with earnings/revenues numbers in the span of the next 3-6 months as vaccines are deployed in late 2020 to early 2021. You have to decide if the market will look past that to the resolution of the pandemic or not.
Some thoughts about the greatest risks and opportunities for the U.S. markets in addition to the coronavirus risk, which is on an immediate basis is #1 in my book…
- A Biden win is not a given. Meet the Press cited data showing V.P. Biden is only 1% ahead of where Sec. of State Hillary Clinton was at the same time point in 2016. Don’t count your chickens too early, if those are your eggs of course…
- A Trump win would likely help the markets continue their climb.
- A Biden win with a Dem Senate, could cause a temporary setback, due to the tax increases (taxes will rise only on those making over $400,000 as individuals and over $622,051 as married couples), but only if the Dems take the Senate. The market would then continue higher as the recovery continues and Biden/Congress spends on healthcare and clean energy as part of a potentially larger infrastructure bill.
- A Biden win without the Senate in Dem control means nothing gets done meaning Trump’s policies stay intact even with him gone. The markets would be OK and rise with that most likely, and a slow recovery would continue with successful vaccines. Stimulus would be less however than with a Dem sweep of both House and Senate plus a Biden win.
- A stimulus bill will NOT be passed prior to the election as that would help Trump win the election and to add to that there are too many GOP Senators who oppose it. This could pressure the markets in the short term. The market is depending on stimulus to tide the economy over, but it could come after the election, unless Trump loses and vetoes the bill just to spite his opponents – then it will have to wait for Biden to take office.
- If the Dems don’t take the Senate back, Joe Biden won’t get much done except that which fits consensus. Maybe some infrastructure spending will be agreed upon. The GOP will block healthcare spending as well as tax law changes. They may agree upon drug price control measures. Spending will be reduced vs. a Biden/Dem Senate outcome.
- Election Outcome Uncertainty: It could take weeks to find out who is President without a landslide in Biden’s favor. The polls say that a Trump landslide is an impossibility given current facts. This uncertainty could pressure the markets a bit in the short term, but whatever discount is created will be a buying opportunity.
- Markets historically have done better under Democrats than under Republicans, so don’t bet against the market just because Biden wins (there may be an initial discount created due to a Trump loss, but it won’t be sustained IMO).
- Trump will leave office if he loses. The GOP will see to that and even the Supreme Court will also do so, despite the tilt to the right that will occur with the addition of Judge Barrett. There appears to be zero doubt she will be on the court before Election Day barring a Senate COVID-19 outbreak that shuts it down.
- Ditch your “Green New” anything stocks if Biden loses. If Trump wins, the rise of clean energy will be further delayed. ADDED NOTE 11-02-20: They will eventually recover due to demand globally, but there would be a swoon with a Biden loss IMO.
- Earnings will be weak for the Q3 quarter being reported as well as for Q4. The question is whether the market will look past that particularly if COVID-19 cases further pressure earnings… ADDED NOTE 11-02-20: I think the market is currently dividend on this, so have SOME cash in case of a greater drawdown.
Follow me on StockTwits/Twitter and you’ll see when and what I buy and sell…
Now let’s go on to look at investor sentiment…
Keep up-to-date and read my comments on the current setup during the week at Twitter and StockTwits (links below) where a combined 34,571 investors are following the markets with me…
Follow Me on Twitter® Follow Me on StockTwits®. (real time messages are on StockTwits as always and back on Twitter)
Join the Conversation in the StockTwits “MarketTiming” Room (I’ll publish comments in the room periodically.)
Now let’s review investor sentiment…
Survey Says!
Sentiment of individual investors (AAII.com) showed a Bull minus Bear percentage spread of -1.09% on 10-14-20, which was the 34th week of a negative sentiment spread! That is astounding, and I analyzed the subsequent market behavior after such long runs of negative sentiment in detail four issues back (see link at top or to upper right).
The last time the AAII sentiment spread approached zero, it got to around -4% for two weeks surrounding the June 8th top. The market corrected about 9% within a few days with a 5.89% drop on June 11th after two small red days on the 9th and 10th.
| Bulls | Neutrals | Bears |
| 34.78% | 29.47% | 35.75% |
| Thurs. 12 am CT close to poll | ||
2. U.S. Small Caps Market Timing – Russell 2000 U.S. Small Cap Index (click chart to enlarge; IWM, RUT)
Small caps have higher sensitivity to recessions/economic slowing, so be careful about being too exposed to them at this point unless you are sure Trump is winning the election. They could be a buying opportunity regardless on a pullback particularly if the vaccines work.
If you don’t want to do anything too extreme, consider taking off 10-25% of your small cap exposure and adding it back later in the case of an IRA account. Whether being taxed will be worth the sell, is unknown, so you may not want to sell your taxable small caps exposure. That’s called “Passive Shorting,” a term I coined. Google it and the page should be at the top…
After you look at the chart below, we look at gold…
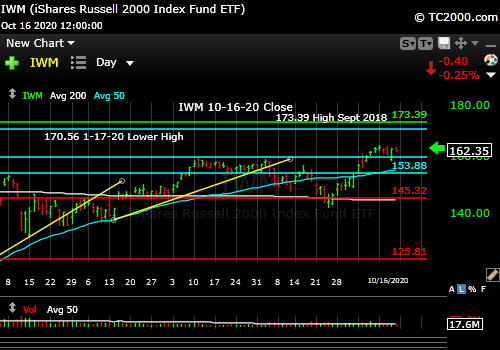
Small caps trending up, but vulnerable to economic slowing from a COVID-19 spike.
3. Gold Market Timing (click chart to enlarge; GLD): It’s just up off support. No important breach yet.
Above 179.04, G*LD is OK (the * is there in G*LD to throw off crawlers looking for prices to target), below that means the downtrend is intact and the correction continues. Eventually I expect gold to continue rising as we spend and spend and spend, but if the Biden/GOP Senate combo happens, spending will be less and gold could pull back.
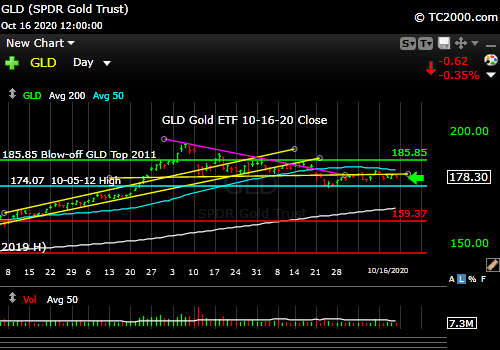
Gold above 179.04 is better than below. A dive below would confirm the downtrend.
Check out the “Market Signal Summary” below – after you review the following chart…
4. Interest Rate Market Timing (10 Year Treasury Yield; click chart to enlarge; TNX, IEF, TLT): The Fed will keep rates within a range. Sell bonds high (TNX near lows) and buy them back low (TNX near highs) to take advantage of the Fed’s interference.

Rates are trapped by economic slowing, COVID-19 resurgence and an active Fed.
Now let’s review three key market timing signals together….
Do not use these signals as a trading plan. They are rough guidelines. I currently share my actual BUYS and SELLS in as timely a way as possible on social media (links above).
MY MARKET SIGNAL AND TREND SUMMARY for a Further U.S. Stock Market Rally with Real GDP Growth (“Real” means above inflation):
Stock Signal BULLISH for a further U.S. stock market rally with a short term BULLISH and longer term Bullish SP500 Index trend. The small caps determine the stock signal in this section of the report. If they are strong/weak, generally the SPX is strong/weak too.
Gold Signal GREEN for a further U.S. stock market rally. The Gold Trend is short term Bearish and longer term Bullish.
Kept for Reference: “Gold can RISE with stocks when real rates are falling, and the dollar is falling. If the dollar gains significant strength, that will hurt both stocks and gold in the near term. Watch the U.S. dollar. And keep in mind that in a financial panic the dollar and gold can rise together. In liquidity crunches (which the Fed is supposed to prevent) gold can drop with everything else but the US dollar.”
What gold does mostly as I’ve written HERE is follow real interest rates around the world (if you own “gold in dollar terms” you care about U.S. rates most of all). The rest of the world does matter however, including massive buying by central banks.
GUIDE: “Remember GLD is being used as an indicator for the ECONOMY here.” If gold continues to rise again, it means the market believes real rates are going to fall or stay negative for a period of time. Investors tend to stay out of gold particularly when stocks are doing well as they provide a higher real return.
Rate Signal: As long as rates stay within a relatively low range, the signals are not as valuable when the Fed is manipulating them. The Rate signal on a non-manipulated basis would be Bullish for a further stock market rally with a short term Bullish and longer term BEARISH 10 Year Yield Trend. (Remember: higher rates mean lower bond and Treasury prices and vice versa). If rates crash to new lows, the market will not likely behave very well!
Thank you for reading. Would you please leave your comments below where it says “Leave a reply”… or ask a question if you like…
Pay it forward by sending the link to MarketTiming.Blog (that link will immediately connect them to this webpage) to a relative or friend. Thanks for doing that.
Be sure to visit the website for more general investing knowledge at:
Standard Disclaimer: It’s your money and your decision as to how to invest it.
I thank Worden Brothers for the charting system I use to post these charts. If you want to know more about the charting system I use every day, contact me for any questions, or click HERE. Please use that link when you sign up as I am an affiliate (I don’t make much, but it may help to pay for some of my website expenses). It makes it much easier to follow along with me if you can see the charts and manipulate them on your own computer. It’s a great investment to have an excellent charting system.
Note: I’ve updated my criteria for the equity signal for a further U.S. stock market rally to the following: GREEN = Bullish, YELLOW = Neutral, RED = Bearish. In other words, the colors tell you whether the signal supports the stock rally or not, while the Bullish, Neutral, and Bearish designations are about the trend.
A BEARISH trend signal does not mean we should not buy. A BULLISH trend signal does not mean you cannot sell some exposure. It depends on what is going on in the economy and how oversold/overbought the market is at a given point whether the Bearish signal is to be sold or bought, sold on the next bounce, etc. and whether a Bullish signal is to be bought or if profits should be taken. A NEUTRAL trend signal does not mean the end of the Bull or Bear. It means to wait and look for possible subsequent entry points within the existing trend, Bull or Bear, but preserve capital if the entry fails. Our strong intention is to buy low and sell high. By the way, I will keep showing the prior orange “Trigger lines” in the IWM and GLD charts for now as reference points only; they have historical value for us from the post-2016 election period.
Copyright © 2020 By Wall Street Sun and Storm Report, LLC All rights reserved.
