A Market Timing Report based on the January 29, 2021 close…
What’s the Market Timing Set-up for February?
We had an initial decent start to the year, and then things got a bit crazy with stocks like Gamestop and AMC going up despite their problematic fundamentals. Is it right or wrong? Neither. It is what it is. Anything can be bid up based on the action of a crowd. We’ve seen what a crowd mentality can do both early as well as late in January. There is huge risk built into overvalued stocks that don’t then hit their numbers. They can fall precipitously once they disappoint.
The upside is fun. The sudden downside, less fun. If you have such gains, take off 100% of your principal once you have a double. That way, you can ride out further volatility and decide when you will protect remaining profits. After selling your principal, you could even set your stop at 50% of profits, which means the stock has to drop by half before you’ll need to act. You can decide at that point whether the downturn was overdone, or if the company is falling apart and whether you should take your remaining profits and redeploy them.
I followed my own advice and took off 100% profits on 8 positions over the past year and a half. I did the same with three different cryptocurrencies over the past couple of weeks (these were recommended by other advisors, so I cannot share those obviously, but I did tell my followers on social media to take profits in the small coins near the height of the cryptomania in January).
I did the same thing with my gold exposure during the 2011 drawdown off the high. I took off 100% of my principal. I can now “ride the gravy,” as I like to say. The pressure to trade the position is gone. I can decide at what price I’ll cut more exposure and may never have to do so. I put on a new GLD trading position more recently and have taken off nearly all of it as gold is behaving badly.
How do people get tricked into thinking the Gamestop trading game is reliable? It can work, but it’s not a reliable way to make money unless you jump shrewdly from mania to mania and take profits as I’ve described. But some will mortgage their house and lose the money on speculations when they start to work against them. What goes up fast, goes down even faster very often.
The human mind is programmable and if you make 100% on your money or more doing the same thing even twice, you are already being programmed if you don’t stay acutely aware. Sadly most human beings walk around in a stupor anchored to their last one or more experience of success or failure, rather than having a plan they execute dispassionately.
On that basis, let’s look at the current level of market fear without being fearful ourselves! Bear with me and reread anything you don’t immediately understand, because the value of what I’m sharing this month is considerable. How you use it is up to you.
The fear indicator I’m talking about is the VIX, the estimate, based on option pricing, of the upcoming 30 days of SP500 Index volatility. In other words, the VIX tells us how wild the swings in the SP500 will become over the next 30 days. When it trends steadily higher, the market goes down into corrections or worse. When it shoots up and dies back, the market just suffers a dip or a mild correction and continues upward. You’ll have to decide how you want to interpret what I share. If you agree or disagree, please comment (respectfully) below.
The interesting thing about the prediction of future market volatility is that when the VIX rises from relatively low levels, the change in the VIX is predictive of market price as it moves up, but when the VIX rises to very high relative levels vs. its base, it becomes a contrary indicator at some point. In other words, it becomes overdone relatively to what happens within the following 30 day period.
To understand VIX peaks and their meaning, I studied the history of the past few big volatility spikes which marked the June, Sept. and Oct. 2020 lows as well as the 2020 COVID-19 Big Bear, the 2018 December Mini Bear, and even the 2000 Big Bear VIX spikes. I published my findings in an Excel File that you should be able to download just below… Print it out if you like so you can follow along with my explanation. Click the following link and when the document, opens press “Read Only.” (I screened the file for viruses, and it came up negative.)
NOTE: When you open up the following Excel Spreadsheet the 2nd Column from the right should say “Drop by Wednesday VIX Peak” as the VIX high was achieved then, not on Friday. Click this link to open the spreadsheet please…
What you see is that the current spike in volatility is far more exaggerated compared to the associate PRICE DROP vs. prior spikes in both corrections as well as various sizes of Bear Markets including both Mini Bears and Big Bears. My Rules for Dips, Corrections and Bears are HERE (Scroll to “New Rules”).
The drawdowns that occurred in the corrections last year were more than twice the level of the current loss off the SP500 Index top of 4.05%. What I did was look at the price of the SP500 Index on the day in each market drawdown when the VIX hit the level it reached at the peak on Wednesday, January 27th. Then I calculated the SPX loss to that point.
What you see is except for the Sept. 2020 Correction, the other corrections and even the Mini Bear Crash of December 2018, when the market lost just over 20%, were nearly at their final lows by the time the VIX hit the level we saw on Jan. 27th. In the Sept. 2020 Correction, the market rose for a few days to a lower high on 9-16-20 and then fell 6.4% from the lower high. Then the market recovered, resuming its uptrend.
We don’t care about small corrections in the market unless we have a plan for trading them. I’m fine with that IF you know how to get back in. But what I am trying to discern here is whether this downturn is likely to be a sizable one or not…
What happened in the Big Bear Markets as I call them? Realize the key is that they are associated with big recessions and financial dislocations. That’s what happened in each of the last Big Bear Markets. The tech market crashed by 78% in the 2000-2003 Bear. The housing market crashed in the 2007 to 2009 Bear as you know. And most recently, there was a left field event called COVID-19 that is essentially a temporary GDP interrupter that was looked past faster than any other market perturbation of its magnitude in history. GDP was temporarily flattened and is now recovering.
The SPX was down over 35% in the COVID-19 Crash, and yet we are already at new all time highs in under a year from the 2-19-2020 peak! Even after the 1987 peak which was followed by Black Monday when the Dow fell over 22.8% in one day, it took almost two years to get back to the prior high. (I was completely OUT of the market the day before Black Monday and about half out by mid-September.
How does the current decline compare to the Big Bears? During those three declines, the SPX was already down over 12% in two cases and over 23% in 2009, which registered the highest VIX spike in history to date. The current SP500 Index decline is just 4.05%! That is 25.17% of the average decline of those three Big Bear Markets when they had reached the current VIX level.
What that means is the VIX index reflects a level of fear way out of proportion to what is actually happening in the market as communicated by current pricing. You want to compare the mania now to 2000? Well, the VIX then reached only 110.2% of the current level.
One might argue “That proves it’s going to get far worse in terms of the losses in the SPX!” No. The losses that should be accompanying it should be 3 times as high if it were a parallel example.
The mispricing of VIX when compared to the prior big Bears, says that back then people were headed into an accident of unknown proportion, but were ACTING accordingly. They are not acting accordingly today. What this says to me since VIX mispricing is routine at market lows is that we could have already made a “dip low” or could enter into, at worst, another further slide to the level I call a correction (new “New Rules”). That is not the end of the world. Yes, for a time, you may feel bad, but markets recover far faster from corrections and typically if you leave during them, you are at risk of missing out on the recovery and even more gains ahead.
My conclusion is that the weight of evidence says investors are “overbuying protection” in the form of put options at a time when the price drop reflects something far more benign than these market players are thinking.
What would lead to a “deep correction”? A fall below the January 4th low would do it I believe. That could take us down to the 200 day moving average or so. Other targets would be the lower magenta channel line shown below or the 2-19-2020 high (green line) we hit prior to the COVID-19 Bear Market Crash. If it goes below there, we are headed to a recession. Since a recession is not in the cards given the current outlook IMO, we should not see the market action that accompanies recessions. It’s always possible to see a Mini Bear Market as we did in December 2018, but the Fed was raising interest rates then.
What could scare the markets into a Mini Bear Market?
A market led “Rate Shock” as I call rapid increases in interest rates could do it. Why? The Fed is not raising rates until it has to, but that does not stop markets from moving rates up and front running the Fed. That is because the market will assume the Fed may have to act sooner rather than later. Tighter monetary policy in a stock market that is currently somewhat pricey historically could create a Dec. 2018 Mini Bear. But they come and go. The Big Bears have a much longer recovery time.
The serious damage comes only with recessions. Could we see an inflation induced recession? Of course, because if the Fed is forced to deal with persistent and rising inflation, PE multiples are compressed as stocks are then sold. But this will take time. The COVID-19 pandemic itself is a damper on inflation. If you want to decrease exposure now for something that may not happen for many months at the earliest, you are welcome to, but the Bull market will resume in my opinion and new highs will be attained, because the global economy is still in recovery mode. The longer the recovery period extends, as long as we make continuing progress, the easier it will be for the market to rise ahead of ever increasing earnings estimates. When everyone is back to work and inflation gets out of hand – then we’ll have to drop our exposure level. It will take some time before we get there.
One of the biggest mistakes I’ve heard retold is from those who left big Bulls too early. 2000 was a great example. If you missed 1999, you missed a massive part of the final move in the market to the upside. Remember too that Bulls don’t die with pitiful sentiment numbers. This week’s sentiment numbers are not excessive, for the AAII investors at least. These somewhat older investors on average will be the last ones to come back to the market in a big way. The “kids” are leading this time! (Hey, some of us are still kids at heart, right?! ;))
We will also watch to be sure we don’t overstay our welcome based on many of the thoughts and considerations just discussed… I don’t look at “one thing.” I look at many things simultaneously.
Now I’ll show you the charts, so you can see where we are. Reread this post more than once, as you’ll pick up new things the second time through. I do that myself. I always reread my post the next market day too, so I ACT on what I believe. First the charts, and then I’ll discuss the possible trading/investing scenarios in a summary form that will help you further “get” what I’ve just said…
1. SP500 Index Market Timing (S&P 500 Index®; SPY, SPX):
You see the immediate trend break, but the close was just barely below the 50 day moving average. The market could easily head lower, but consider the scenarios I lay out after the chart review before acting.
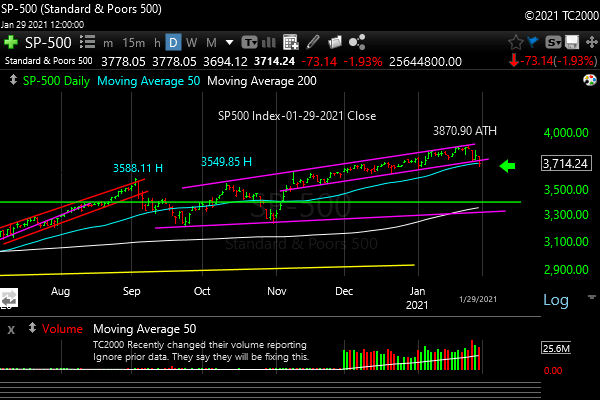
The immediate trend is broken, but not the longer term trend.
Now let’s go on to look at investor sentiment…
Keep up-to-date and read my comments on the current setup during the week at Twitter and StockTwits (links below) where a combined 34,571 investors are following the markets with me…
Follow Me on Twitter® Follow Me on StockTwits®. (real time messages are on StockTwits as always and back on Twitter)
Join the Conversation in the StockTwits “MarketTiming” Room (I’ll publish comments in the room periodically.)
Now let’s review investor sentiment…
Survey Says!
Sentiment of individual investors (AAII.com) showed a Bull minus Bear percentage spread of -0.6%, which was 1st week of negative sentiment spread since the last negative reading in a 34 week continuous series of negative sentiment spreads!
The peak positive sentiment was on Nov. 11th at 31.0%, two days after the election results were known (it was known the prior Saturday who won). That is a respectably high sentiment spread for a Bull market, and it does not often stay up there forever, but we just made a new all time market high in the SP500 Index on Tues. 1-26, and the spread had fallen to just 13.5% by 1-06 after a small 1.48% drop in the SPX. The market then headed higher.
This is not the way Bull markets generally end. Bull markets end with the vast majority of investors enthusiastic about stocks. Despite the Gamestop, AMC, etc. hype this week, we are not there yet.
Were the “AAII investors” right back in Feb. – March 2020? Investors in the AAII Survey did turn negative on 1-30-20 after the first little drop in the SPX. Then there was a rally back to a new all time high (ATH). So following them did not really work. After that, sentiment turned back to negative at -8.7% on 1-26-20. From there the market rallied to the 3-04-20 high before turning down again, so they missed that move.
Then the market continued to crash to the 3-23-20 final low of that Big Bear Market. And then the AAII investors froze in the headlights for 34 long weeks of net negative sentiment!!! Horrible idea in a raging Bull market!
I’ll get to the scenarios to consider, but first let’s look at the small caps, gold, and interest rates…
| Bulls | Neutrals | Bears |
| 37.7% | 24.0% | 38.37% |
| Thurs. 12 am CT close to poll | ||
2. U.S. Small Caps Market Timing – Russell 2000 U.S. Small Cap Index (click chart to enlarge; IWM, RUT)
The breach on higher volume means some more downside cannot be excluded, but the intermediate term trend is still intact.
See my scenarios after we look at gold and interest rates…
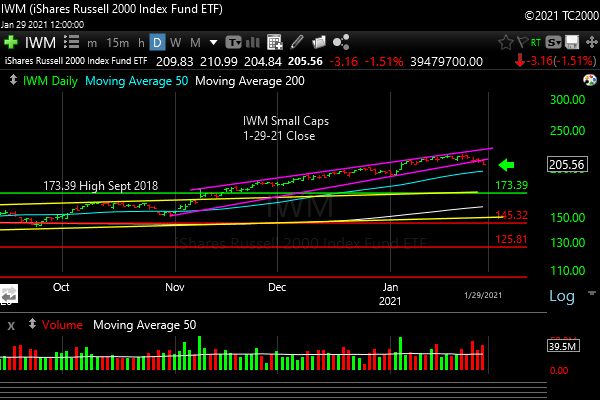
Short term trend breach.
3. Gold Market Timing (click chart to enlarge; GLD):
Gold remains in the doldrums due to a recovering economy and rising real interest rates. Read my link posted below this report on how to invest in gold properly…
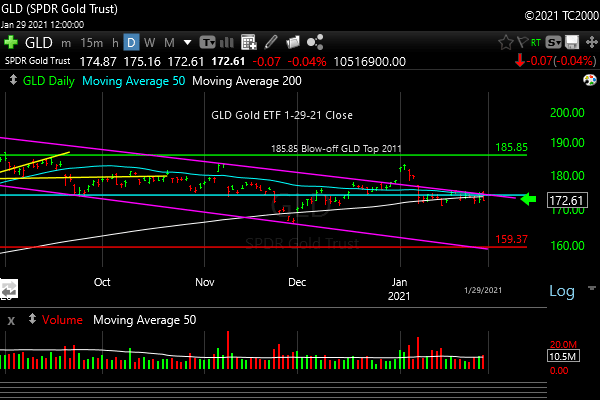
Gold still not working.
Check out the “Market Signal Summary” below – after you review the following chart…
4. Interest Rate Market Timing (10 Year Treasury Yield; click chart to enlarge; TNX, IEF, TLT): The trend was reasserted as UP this week.
From last issue. Same thing holds: The rate of rise is the key, not the level in a strong recovery until we reach 4.5-5% some say, but regardless of the precise level that spells “trouble,” it’s MUCH higher than we are now. A rapid rise in rates is what I call a “Rate Shock” and it’s something that could send the market into a correction at least. So far, it’s not a problem and COVID-19 will probably slow the recovery and keep interest rates at least relatively lower for longer…
Now we turn to the scenarios for investing and trading… (below the chart)

Rates rising still.
Scenarios for Trading and Investing:
- “That was it!” Scenario 1A) Friday was the low as after the 10-29-20 VIX high. The market was done going down the next day. Scenario 1B) even if we revisit the same low a few weeks from now as happened in June 2020, all will be well with the trend. Either of these could be the eventual scenario. We are headed into a stronger recovery via vaccine deployment and resumption of life.
- “That was just the start! We are headed into a massive Bear Market yet again.” I consider this highly unlikely due to the fact that the recovery is not even close to complete yet. Vaccination needs to be sped up, yes, but it’s happening and 70% of people are now wearing masks. More need to do so. The number of active cases is high for sure, and we need to start seeing a DROP in them as I’ve gone over along with my #COVID19 charts for many weeks now (see my social media COVID-19 posts; search @SunAndStormInv and “#COVID19” on Twitter to find them). Still, the economy is recovering, not involuting. The Y/Y comparisons remain positive for this and next quarters. Then we’ll see where the recovery is.
- “We could go up a bit and then move to a new somewhat lower low.” Yes we could. That happened after the 9-04-2020 VIX high. (see table link above) The trend would still be fine.
- “December 2018 could happen now.” Meaning a “Mini Bear Market” could occur now. That is not likely IMO. The fear level now is higher than it was at the bottom of that market move. I believe the price would already be lower if this were what I call a “Mini Bear Market.” (You won’t understand that last comment unless you know my “New Rules.” Read it if you haven’t and come back to read this. See link above.)
The gist of my favored scenarios (1A, 1B, or 3) above is that the price move of only -4.05% for the SPX pales in comparison to prior similar VIX readings when the drawdowns were much bigger. I think the fear is currently overdone and a false signal.
Could I be wrong? Of course. If the UK virus variant a.k.a. Variant of Concern 202012/01) takes hold in a bigger way in our country (being predicted by Dr. Osterholm btw) where mask wearing is still optional for some (30% anti-maskers plus 25% who wear their mask below their nose – nice try but that won’t work!), things could get even worse on the COVID19 front for example. (My apologies to the Brits (and Scottish) with whom combined, I am about 70% homologous for singling out their variant!)
The intermediate U.S. stock market trend will break, if we are headed to a worse outcome. I’ll let you know on social media if I see that. And the vaccine prevents bad outcomes even with the variants apparently, even though the antibody affinity for the South African mutant virus (apologies to the South Africans; aka “501.V2”) is weaker.
If the intermediate term trend breaks, you’ll see me drop my market exposure. Stay close by following me on Twitter and StockTwits (sometimes one of them has been down. I use the one that is UP when that happens!).
Now let’s review three key market timing signals together….
Do not use these signals as a trading plan. They are rough guidelines. I currently share my actual BUYS and SELLS in as timely a way as possible on social media (links above).
MY MARKET SIGNAL AND TREND SUMMARY for a Further U.S. Stock Market Rally with Real GDP Growth (“Real” means above inflation):
Stock Signal BULLISH for a further U.S. stock market rally with a short term NEUTRAL and longer term Bullish SP500 Index trend. The immediate trend break is the issue here. The small caps determine the stock signal in this section of the report. If they are strong/weak, generally the SPX is strong/weak too.
Gold Signal GREEN for a further U.S. stock market rally. The Gold Trend is short term Bearish and longer term Bearish. It is still in its down trend channel. “Longer term” may only be for a few more months or much longer. No one can tell you how long it will continue to decline. Economic glitches that arise will help gold. Unconstrained fiscal spending will help as well over time, but not while the economy is recovering at a reasonable pace.
Kept for Reference: “Gold can RISE with stocks when real rates are FALLING, and the dollar is falling. Gold has recently been falling with rising real rates, despite US dollar weakness, because the stock market is made more attractive by the combination of 1. Rising real rates and 2. Economic recovery with higher corporate earnings.
In liquidity crunches (which the Fed is supposed to prevent) gold can drop with everything else but the US dollar.”
What gold does mostly as I’ve written HERE is follow real interest rates around the world (if you own “gold in dollar terms” you care about U.S. rates most of all). The rest of the world does matter however, including massive buying by central banks.
GUIDE: “Remember GLD is being used as an indicator for the ECONOMY here.” If gold continues to rise again, it means the market believes real rates are going to fall or stay negative for a period of time. Investors tend to stay out of gold particularly when stocks are doing well as they provide a higher real return.
Rate Signal: As long as rates stay within a relatively low range, the stock market can cope with the rise in rates. That said rates are still RISING and that hurts interest rate sensitive stock sectors like utilities. The rate signal is Bullish for a further stock market rally with a short term Bullish, and an intermediate term BULLISH 10 Year Yield Trend. Rates have to bust that lid of 1.266% on the chart above to change the intermediate to longer term trend unequivocally to UP. (Remember: higher rates mean lower bond and Treasury prices and vice versa).
Thank you for reading. Would you please leave your comments below where it says “Leave a reply”… or ask a question if you like…
Pay it forward by sending the link to MarketTiming.Blog (that link will immediately connect them to this webpage) to a relative or friend. Thanks for doing that.
Be sure to visit the website for more general investing knowledge at:
Standard Disclaimer: It’s your money and your decision as to how to invest it.
I thank Worden Brothers for the charting system I use to post these charts. If you want to know more about the charting system I use every day, contact me for any questions, or click HERE. Please use that link when you sign up as I am an affiliate (I don’t make much, but it may help to pay for some of my website expenses). It makes it much easier to follow along with me if you can see the charts and manipulate them on your own computer. It’s a great investment to have an excellent charting system.
Note: I’ve updated my criteria for the equity signal for a further U.S. stock market rally to the following: GREEN = Bullish, YELLOW = Neutral, RED = Bearish. In other words, the colors tell you whether the signal supports the stock rally or not, while the Bullish, Neutral, and Bearish designations are about the trend.
A BEARISH trend signal does not mean we should not buy. A BULLISH trend signal does not mean you cannot sell some exposure. It depends on what is going on in the economy and how oversold/overbought the market is at a given point whether the Bearish signal is to be sold or bought, sold on the next bounce, etc. and whether a Bullish signal is to be bought or if profits should be taken. A NEUTRAL trend signal does not mean the end of the Bull or Bear. It means to wait and look for possible subsequent entry points within the existing trend, Bull or Bear, but preserve capital if the entry fails. Our strong intention is to buy low and sell high. By the way, I will keep showing the prior orange “Trigger lines” in the IWM and GLD charts for now as reference points only; they have historical value for us from the post-2016 election period.
Copyright © 2021 By Wall Street Sun and Storm Report, LLC All rights reserved.

The upward market trend momentum is reversed and the question, IMO, is there a liquidity crunch that will surprise investors. That could lead to a financial crisis in which case the markets decline will be much deeper.
I don’t see that in the near term. There is more stimulus on the way and the Fed is squarely standing in the way of that scenario…for now. When inflation is up much more, then that could come into play. I’ll be monitoring the rate of change of rates. Too fast = “Rate Shock” which is a risk that could throw a wrench into the current trend.