A Market Timing Report based on the March 19, 2021 close…
What’s the Market Timing Set-up Now?
The Tech Sector became grossly overvalued (numerous stocks with massive Price/Sales ratios), and some of that is being corrected. However, new lows in QQQ and/or XLK, which track each other fairly closely, will damage the SPX and likely also IWM (small caps) and IJH (mid caps – which have been doing the best and are still mid range in their up channel). Prices are relative. The other indexes can levitate a bit longer as tech crashing and then they’ll all trend together in a bigger correction, Mini Bear Market, or Big Bear Market (enter “New Rules” in the search box to find my numbers for those).
Take profits “high” if you can, but I’d advise that you sell falling stocks in steps as they fall, just in case you see a bounce, sustained or not. Decide what profit you intend to protect and do it. If you can sell 20-50% of your exposure near a high (depending on your tax situation and how much you want to trade your positions), then you can sell the rest if the trend breaks down in a given stock or ETF. Some stocks and ETFs will fail earlier than others. Be careful not to sell strong stocks and then not rebuy them if the trend reverses. You MUST be disciplined in both taking profits (especially when you have BIG profits; see my last issue for my selling rules on stocks making big gains) AND also in the rebuying of stocks and ETFs you have sold.
IF you sell at least some of your exposure high enough and the market continues down, you can engage in what I have coined as Passive Shorting You can sell 2 or 3 times, incrementally, as long as you don’t do it too late. You should generally buy in steps too. Many don’t.
There is no secret formula, although I measure weakness using multiple signals (I share my moves, buys and sells on social media; links below). Your last sell or even your first can be wrong , and you must have the discipline to buy back lower or don’t do the selling in the first place – unless the stock, sector, or country ETF is no longer a buy of course. Buy incrementally after a fall, as you don’t know where the bottom will be until you get there. Buy some of your renewed exposure on the confirmation of a bounce.
You don’t have to capture every single percent of gain off a bottom to succeed, and you generally won’t.
1. SP500 Index Market Timing (S&P 500 Index®; SPY, SPX):
You can see that Friday was what I refer to as a “cute close.” It’s a tease to draw in Bears who say “That line is broken!” But the trend is still up. We just made a higher high and have not made a lower low. That’s about all you need of technical analysis to get the big moves right, which are by far the most important. I’ll discuss the possible paths of the market going forward below…

Hugging the lower up channel line (magenta).
Keep up-to-date and read my comments on the current setup during the week at Twitter and StockTwits (links below) where a combined 34,571 investors are following the markets with me…
Follow Me on Twitter® Follow Me on StockTwits®. (real time messages are on StockTwits as always and back on Twitter)
Join the Conversation in the StockTwits “MarketTiming” Room (I’ll publish comments in the room periodically.)
Now let’s review investor sentiment…
Survey Says!
Sentiment of individual investors (AAII.com) showed a Bull minus Bear percentage spread of +25.3%, which is relatively high, but not at an extreme yet. That gives the Bulls room to the upside if they want it.
| Bulls | Neutrals | Bears |
| 48.9% | 27.5% | 23.6% |
| Thurs. 12 am CT close to poll | ||
Now let’s look at the small caps, gold, and interest rates…
2. U.S. Small Caps Market Timing – Russell 2000 U.S. Small Cap Index (click chart to enlarge; IWM, RUT)
Small caps made a new high, although a marginal one, and are still above the 50 day moving average, which is just a reference point for the degree of weakness. The negative is that we are still not back within the prior upward channel (although the midcaps are within their up channel). SPX is at the base of its up channel as we reviewed above.

Below channel but above the 50 day moving average and just made a higher high.
3. Gold Market Timing (click chart to enlarge; GLD):
Same as last time. Gold’s being doing horribly and remains in the doldrums due to a recovering economy and rising real interest rates. Read my link posted below this report on how to invest in gold properly. I use gold only as fiat currency disaster insurance (think Venezuela) when it turns weak. I sell my entire gold trading position in a gold downtrend and have done just that. At the same time, I’ve increased exposure to commodities through oil stocks, oil service stocks, rare earth minerals, and agricultural commodities as my social media entries have told you. I also own positions in cryptocurrencies, which trade like commodities in terms of volatility, although more limited in supply than commodities.
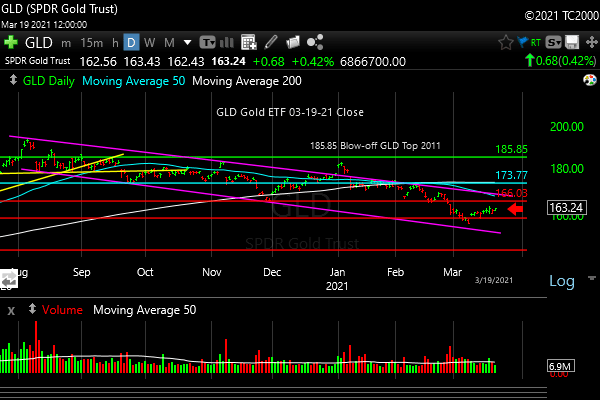
Gold is mid channel in a long down trend.
Check out the “Market Signal Summary” below – after you review the following chart…
4. Interest Rate Market Timing (10 Year Treasury Yield; click chart to enlarge; TNX, IEF, TLT): Same: The trend was reasserted as UP this week. Funny how things don’t change very fast in strong trends!
From two issues ago. Same thing holds: “The rate of rise is the key, not the level of interest rates in a strong recovery until we reach 4.5-5% some say, but regardless of the precise level that spells “trouble,” it’s MUCH higher than we are now. A rapid rise in rates is what I call a “Rate Shock,” and it’s something that could send the market into a correction at least.”
Have we just had a “Rate Shock”? Yes, and the issue is whether there will be more or whether we’ll get a bit of a break at this level.
The recent rise as you see on the chart has been far too fast and the 10 Year Yield has burst up and out of the channel it was previously in – twice in fact. At this point, you can see a Doji candlestick formed on Thursday (often a sign of reversal) and the market went sideways on Friday. I believe rates will have to ease a bit for the stock market to stabilize.
If rates just keep ramping up in too steep a fashion, we’ll head into a full stock market correction at a minimum – an ALL CAP correction, and not just in tech.
Now we turn to the scenarios for investing and trading and update them… (below the chart)
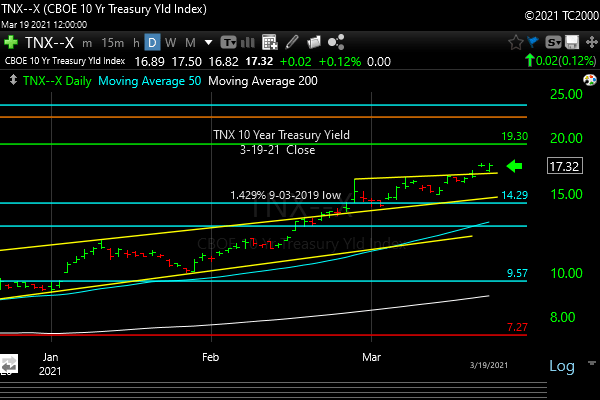
Rates rising, but the current picture suggests a pullback could occur soon.
Scenarios for Trading and Investing:
(My updates are after the >>>>)
A. “That was it!” Scenario A1) Friday was the low as after the 10-29-20 VIX high. The market was done going down the next day. Scenario A2) even if we revisit the same low a few weeks from now as happened in June 2020, and then bounce, all will be well with the trend. Either of these could be the eventual scenario. We are headed into a stronger recovery via vaccine deployment and resumption of life.
>>>>> The 1-29 low DID hold as the SPX dropped to just above that January low. It may still hold, and it must hold, or else…
B. “That was just the start! We are headed into a massive Bear Market yet again.” I consider this highly unlikely due to the fact that the recovery is not even close to complete yet. Vaccination needs to be sped up, yes, but it’s happening and 70% of people are now wearing masks. More need to do so. The number of active cases is high for sure, and we need to start seeing a DROP in them as I’ve gone over along with my #COVID19 charts for many weeks now (see my social media COVID-19 posts; search @SunAndStormInv and “#COVID19” on Twitter to find them). Still, the economy is recovering, not involuting. The Y/Y comparisons remain positive for this and the next quarter. Then we’ll see where the recovery is.
>>>>Still unlikely due to the future greater and greater reopening. Remember too, stimulus is being piled on top of stimulus, which could push the market far higher than anyone believes right now. Tech may even resume its uptrend, but for now, the reopening stocks are taking money from overvalued tech.
C. “We could go up a bit and then move to a new somewhat lower low.” Yes we could. That happened after the 9-04-2020 VIX high. (see table link above) The trend would still be fine.
>>>> At this point, I do not believe the market will tolerate a new recent SPX low. If that happens, we’ll enter into a deeper correction in every cap (small, mid, and large) IMO.
D. “December 2018 could happen now.” Meaning a “Mini Bear Market” could occur now. That is not likely IMO. The fear level now is higher than it was at the bottom of that market move. I believe the price would already be lower if this were what I call a “Mini Bear Market.” (You won’t understand that last comment unless you know my “New Rules.” If you don’t know my rules, please see THIS.)
>>>>Same answer as above for 2. But we need to hold the Jan. low.
The gist of my favored scenarios (A1, A2, or C) above is that the price move of only -4.05% for the SPX pales in comparison to prior similar VIX readings when the drawdowns were much bigger. I think the fear is currently overdone and a false signal.
>>>> I was right as it turned out. The SP500 Index made a new all time high (ATH).
SAME AS BEFORE: “If the intermediate term trend breaks, you’ll see me drop my market exposure. Stay close by following me on Twitter and StockTwits (sometimes one of them has been down. I use the one that is UP when that happens!).”
Now let’s review three key market timing signals together….
Do not use these signals as a trading plan. They are rough guidelines. I currently share my actual BUYS and SELLS in as timely a way as possible on social media (links above).
MY MARKET SIGNAL AND TREND SUMMARY for a Further U.S. Stock Market Rally with Real GDP Growth (“Real” means above inflation):
Stock Signal BULLISH for a further U.S. stock market rally with a short term Bullish and longer term Bullish SP500 Index trend. The immediate trend break is the issue here. The positive is that IWM made a new ATH. The small caps determine the stock signal in this section of the report. If they are strong/weak, generally the SPX is strong/weak too.
Gold Signal GREEN for a further U.S. stock market rally. The Gold Trend is short term Bearish and longer term Bearish. It is still in its down trend channel. “Longer term” may only be for a few more months or much longer. No one can tell you how long it will continue to decline. Economic glitches that arise will help gold. Unconstrained fiscal spending will help as well over time, but not while the economy is recovering at a reasonable pace and real rates are rising.
Kept for Reference: “Gold can RISE with stocks when real rates are FALLING, and the dollar is falling. Gold has recently been falling with rising real rates, despite US dollar weakness, because the stock market is made more attractive by the combination of 1. Rising real rates and 2. Economic recovery with higher corporate earnings.
In liquidity crunches (which the Fed is supposed to prevent) gold can drop with everything else but the US dollar.”
What gold does mostly as I’ve written HERE is follow real interest rates around the world (if you own “gold in dollar terms” you care about U.S. rates most of all). The rest of the world does matter however, including massive buying by central banks.
GUIDE: “Remember GLD is being used as an indicator for the ECONOMY here.” If gold continues to rise again, it means the market believes real rates are going to fall or stay negative for a period of time. Investors tend to stay out of gold particularly when stocks are doing well as they provide a higher real return.
Rate Signal: Rates are still RISING and that hurts interest rate sensitive stock sectors like utilities and helps financials. The Rate signal is Bullish for a further stock market rally with a short term Bullish, and an intermediate term BULLISH 10 Year Yield Trend as long as rates don’t run up too fast (“Rate Shock” is not taken well by the markets). (Remember: higher rates mean lower bond and Treasury prices and vice versa).
Thank you for reading. Would you please leave your comments below where it says “Leave a reply”… or ask a question if you like…
Pay it forward by sending the link to MarketTiming.Blog (that link will immediately connect them to this webpage) to a relative or friend. Thanks for doing that.
Be sure to visit the website for more general investing knowledge at:
Standard Disclaimer: It’s your money and your decision as to how to invest it.
I thank Worden Brothers for the charting system I use to post these charts. If you want to know more about the charting system I use every day, contact me for any questions, or click HERE. Please use that link when you sign up as I am an affiliate (I don’t make much, but it may help to pay for some of my website expenses). It makes it much easier to follow along with me if you can see the charts and manipulate them on your own computer. It’s a great investment to have an excellent charting system.
Note: I’ve updated my criteria for the equity signal for a further U.S. stock market rally to the following: GREEN = Bullish, YELLOW = Neutral, RED = Bearish. In other words, the colors tell you whether the signal supports the stock rally or not, while the Bullish, Neutral, and Bearish designations are about the trend.
A BEARISH trend signal does not mean we should not buy. A BULLISH trend signal does not mean you cannot sell some exposure. It depends on what is going on in the economy and how oversold/overbought the market is at a given point whether the Bearish signal is to be sold or bought, sold on the next bounce, etc. and whether a Bullish signal is to be bought or if profits should be taken. A NEUTRAL trend signal does not mean the end of the Bull or Bear. It means to wait and look for possible subsequent entry points within the existing trend, Bull or Bear, but preserve capital if the entry fails. Our strong intention is to buy low and sell high. By the way, I will keep showing the prior orange “Trigger lines” in the IWM and GLD charts for now as reference points only; they have historical value for us from the post-2016 election period.
Copyright © 2021 By Wall Street Sun and Storm Report, LLC All rights reserved.
