“Market Timing Blog™ Updates for the Week of 10/07/2026”
The most current update is just below the intro…
I will be posting updates on Opportunity Ranges™, along with selective market timing charts at times. Some will still be posted to social media. You’ll see trades first posted to StockTwits® generally, so please see the links below to connect…
Remember to interpret the range positions in the context of daily price charts…
In a strong uptrend, you #BuyTheSlips as I often say. You can make more money on your investments by paying attention to how overbought or oversold a stock is.
For a stock in a steep downtrend, you would not buy it if it only rose to 40-60% within the range; instead, you would sell some of it at least if you want to lower your exposure to further losses.
Feel free to ask questions, and if you have one ask it below or on social media!
10/09/2026 Market Timing Updates:
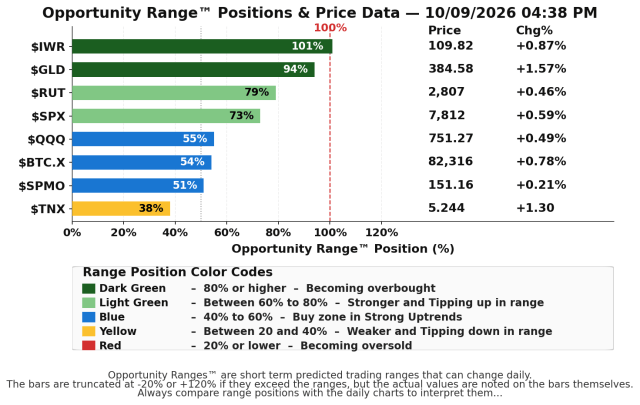
IWR which is Midcap Growth and Value was +0.87% today. We own IJK (Mid Growth) which was +1.03% for today.
IWR led again in Opportunity Range™ position as well as in return among the U.S. equity indexes noted in the table. Gold regained some buying interest with GLD closing at 94% within its range at the end of the trading day. Bitcoin was close behind in gains, but not stretched!
10/07/2026 Market Timing Updates:
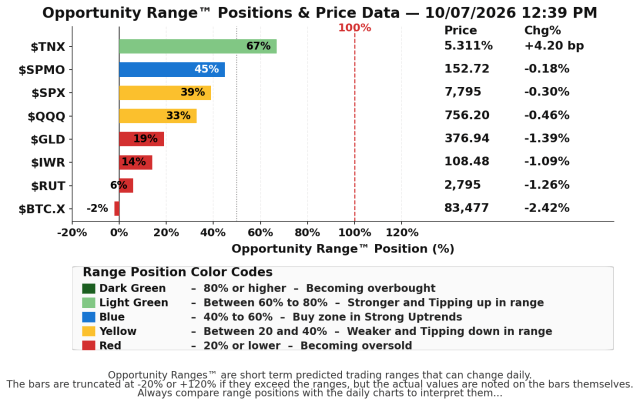
Slight pressured selling in Bitcoin (BTC) and RUT (IWM).
Why? TNX 10 Year Treasury Yield is up another 4.2 bp and still ramping higher.
SPMO is holding up best among the equity inv. listed, but at this point pure large Tech is leading. From the July low, rank is XLK, IGM, and then QTEC (pure tech from QQQ). IGM is a broad tech ETF. XLK is at 33% in its ORange™, not bad, but slightly below the 40-60% level. I’d watch XLK for a lower entry point (see next point!).
There could be more follow through selling into the next 1-2 days at which point a bounce COULD start. That’s the minimum day count to being oversold, but if rates keep ramping, there won’t be a bounce, so watch TNX closely!
Keep up-to-date and read my comments on the current setup during the week at the below links) where a combined 37,184 investors follow the markets with me…
and because it’s good to have a backup…
Follow me on the oligarch’s network… 😉
Real time messages are on StockTwits as always and appear a bit later on X/Twitter (following me on two platforms ensures that you have a backup to get my posts btw, when one may be down. It happens…).
Thank you for reading. Would you please leave your comments below where it says “Leave a reply”… or ask a question if you like…
Pay it forward by sending the link to MarketTiming.Blog (that link will immediately connect them to this webpage) to a relative or friend. Thanks for doing that. I appreciate it!
See the tabs at the top of this blog on my approach to the short term and longer term trends, and be sure to visit the website for more general investing knowledge at:
Standard Disclaimer: It’s your money and your decision as to how to invest it.
“Market Timing Blog™ Updates for the Week of 9/28/2026”
10/02/2026 Market Timing Updates:
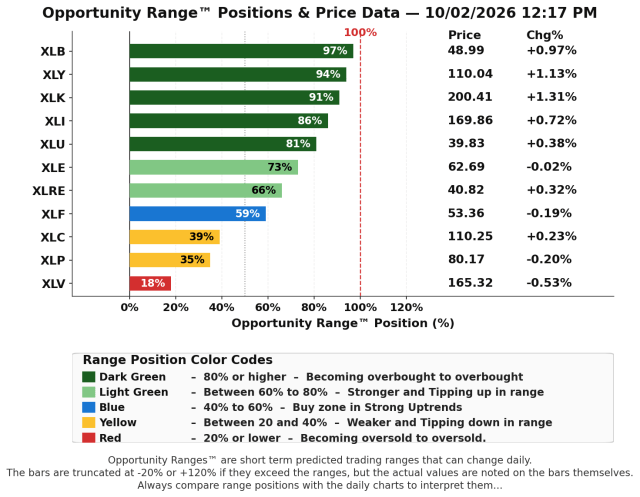
XLK leads on gains and XLB on position in the range (XLB is almost to the top of the range at 97% of the predicted top of the range for today). XLF is a great example of what not to buy when it’s in the blue (40-60% in the range and in a downtrend on the daily chart).
Blue means it could be going either way. It’s a decent short if the trend is down in this case for XLF. Take a look at the daily chart on Yahoo Finance or other system, and you will see…
XLE on the other hand is light green and still in an uptrend despite the recent pullback on oil’s decline. It could be bought if you don’t mind assuming the implicit “Trump risk” around the war with Iran.
XLV is below the buy zone and has broken down again from another lower higher, which means the immediate trend is not your friend…
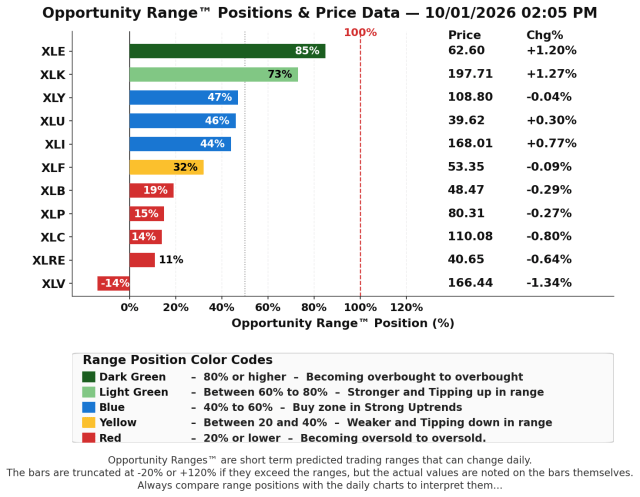
10/01/2026 Market Timing Updates:
XLK and XLE are leading with XLV trailing with some pressured selling (sold below the predicted range low for the day)…
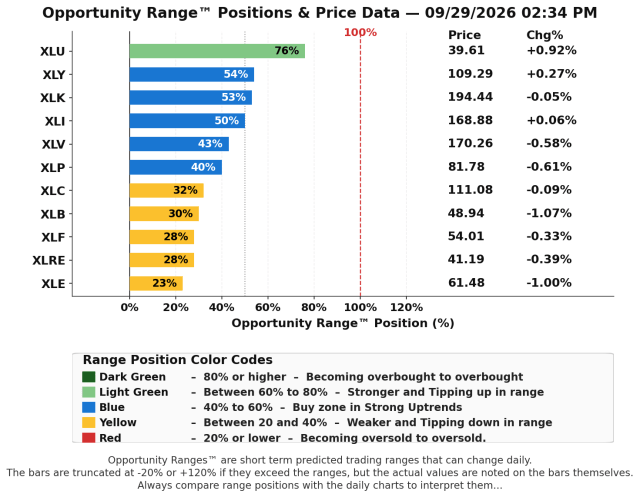
09/29/2026 Market Timing Updates:
XLK is the best daily chart, but near an all time high (ATH), so it needs to make a new high.
XLP, XLI, and XLY are also “in the blue” but attempting to hold lows. If they hold good, if not, use a stop if you intend to buy them. If you buy XLK near this high, I would also use a stop…
09/28/2026 Market Timing Updates:
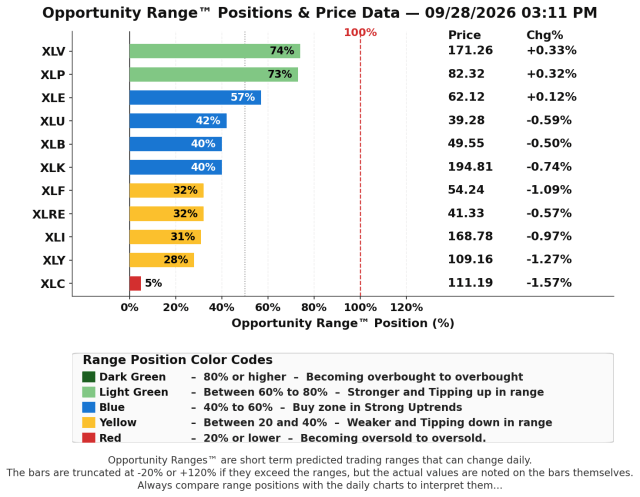
3:11 pm Update:
Since this morning’s comment XLC still trails in range position and degree of loss for the day, but XLV has moved slightly ahead of XLP. XLK is in the right buy range as a strong uptrend, but needs to make a new high (see its daily chart)…
09/28/2026 – 10:28 am Update:
Gold is experiencing strong pressured selling with GLD down 3.7% at the moment. The only other actual strength on the board is TNX, the 10 Year Treasury Yield (now at 5.272%; 11:00 am ET up a stiff 8.7 basis points). This represents a further rate shock, which means the market is concerned that the Federal Reserve is behind, virtually insuring further rate hikes by the Fed.
Higher rates compete with gold, as it has no yield, which is why it likes lower REAL interest rates, which is the rate of return of bonds minus inflation.
Smaller companies needing external funding for growth don’t care for higher rates either, as you see with small and mid caps both down again today and weak in their ranges (both are in downtrends).
Gold also looks like it’s on its way to retesting the prior major low. Once GLD broke that 390.20 level I shared with you on social media, I was skeptical that it would hold, and it didn’t…
I’ll be posting the sector picture later today around 3 pm ET, so please check back here or click the pic on social media. At the moment XLC trails at 9% in its range for the day, with XLP leading at 77% in its range for today, both above water for now… (the update time is obviously a.m. not p.m. ;))
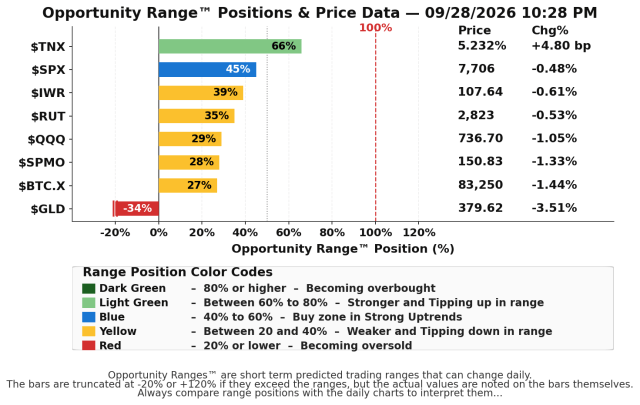
Gold is experiencing significant pressured selling.
09/23/2026 Market Timing Updates:
The elephant in the room in terms of impact is the 10 Year Yield, TNX, which is exploding to the upside, breaching today’s range by a mile.
TNX is up a whopping 16.20 basis points today…
Note that SPMO is down 1.25% with a range position right on the edge of what is normally buyable in a strong uptrend. It’s having an “inside day” today, so it’s not quite as bad as it looks.
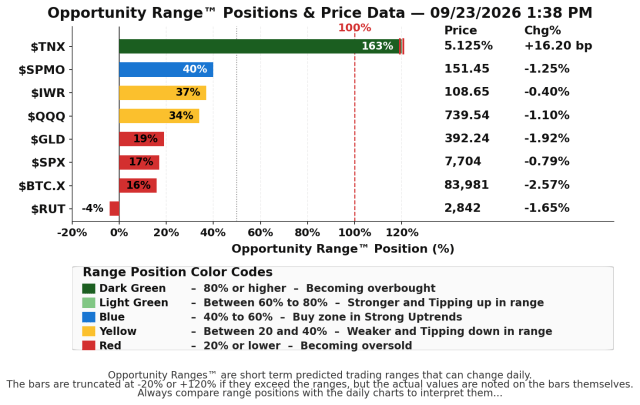
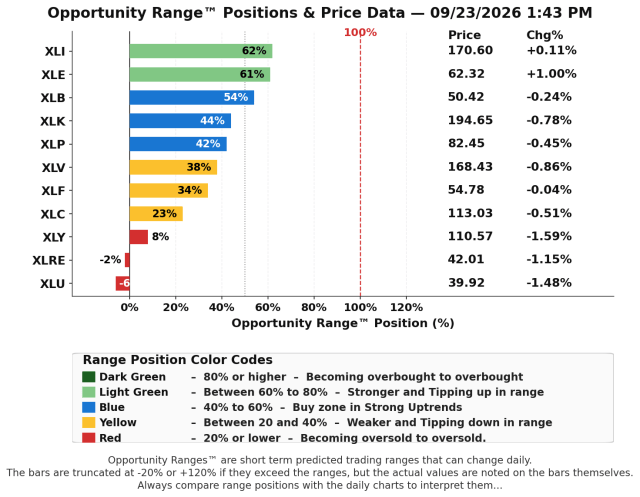
XLY, XLRE, and XLU are all interest rate sensitive, which explains their weakness. (consumer discretionary, real estate, and utility sectors)
XLE (oil sector) is near the top of the heap in range position and leads by a lot in performance at +1.00% for today.
09/22/2026 Market Timing Updates:
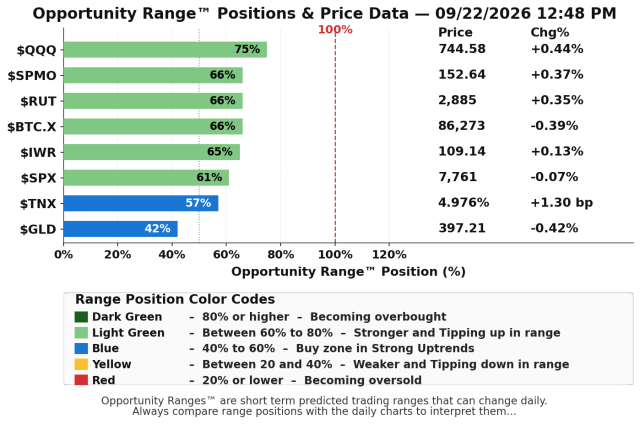
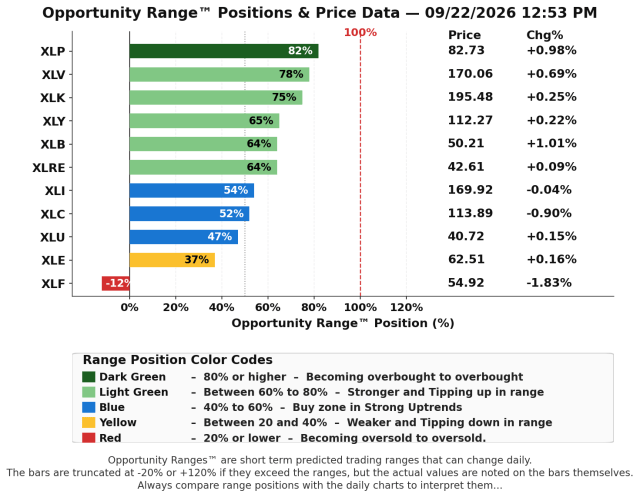
The numbers have changed somewhat from the above as it’s now 1:52 pm, but not by much. It was important to get this 1st post of it’s kind right!
Standard Disclaimer: It’s your money and your decision as to how to invest it.
Copyright © 2026 By Wall Street Sun and Storm Report, LLC All rights reserved.

