Market Timing Brief for the SP500 Index Close on 2-28-2014: Up and Over

A Market Timing Report based on the 2-28-2014 Close published Sunday March 2, 2014

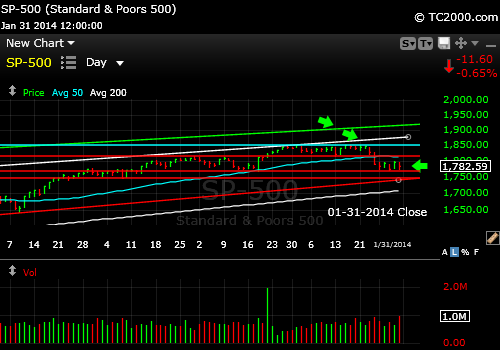
The SP500 Index (SPX, SPY) is at an ALL TIME HIGH (or by Monday WAS).  Yes, that record and it’s also two days over the prior intraday all time high set on 1-15-2014.  The issue is that there is a resistance line (top white line) at which the SP500 stopped on Friday after falling back from a clear cut breakout.  So Monday is the big decision point.   As of this time, our futures are down 0.90% from CNBC’s fair value number and Asian markets are faring even worse.

Here’s the SP500 Index Chart: (Note that the 50 day moving average is buried under the second red line from the top as they converge.)

sp500-index-market-timing-chart-2014-02-28-close

Over the top or is it? Right at a resistance line at an all time high.

Please read my investor sentiment work from the end of the week if you haven’t.  It gives you my latest trading strategy.  You can access those thoughts after getting the password here: Free Subscription to My Newsletter and access to my latest comments  I’ll send you back the password to the access page and the monthly newsletter in the same email.

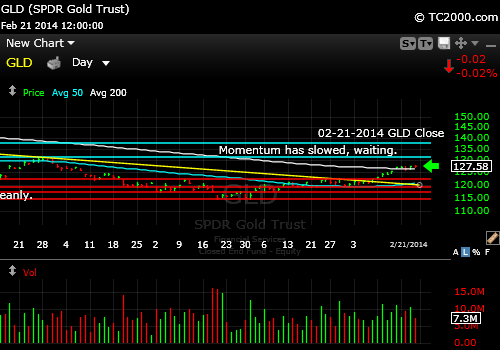
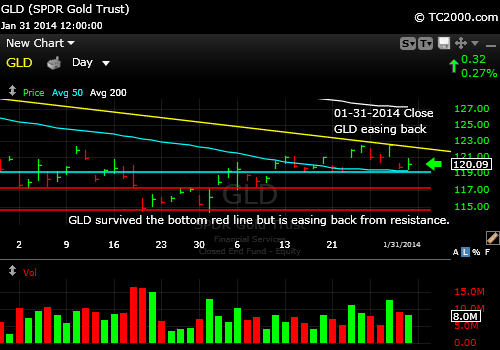
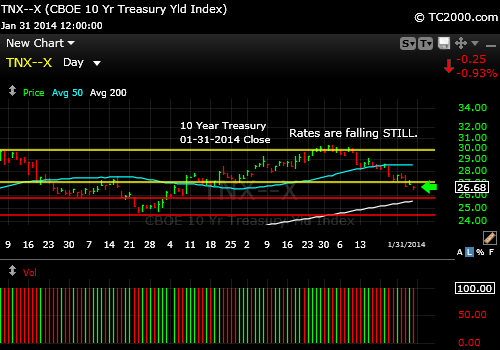
NOTE: The Gold and 10 Year Treasury Market Charts will be posted shortly.  See the link to the upper right.  Thanks.

Standard Disclaimer: It’s your money and your decision as to how to invest it.

I also comment regularly on Twitter: Follow Me on Twitter

I thank Worden Brothers for the chart system I use to post these charts.  If you want to know more about the charting system I use every day, go to my “Other Resources” page here:  Other Resources   It makes it much easier to follow along with me if you can see the charts and manipulate them on your own computer, so it’s a great investment to have an excellent charting system.

Look for updates on the main chart tracking pages this week as I feel they are needed and comments via Twitter.

Copyright © 2014 By Wall Street Sun and Storm Report, LLC All rights reserved.

Posted in investment, large cap stocks, S&P 500 Index | Tagged , , , | Leave a comment

Market Timing Brief for the SP500 Index Close on 2-21-2014: The Kiss Has Been Had

A Market Timing Report based on the 2-021-2014 Close published Saturday February 23, 2014

And now we’ll see if it’s more than just a kiss of a top.  The SP500 Index (SPX, SPY) did come very close to the prior high (not the even earlier all time high though) and it pulled back.   Is that it?  No one can tell you and everyone can guess.  Instead of guessing, we learn from the market.  In the past, as I detail on the private access page (get the password below), damage such as we’ve seen recently is not often followed by new highs.  So maybe that is a bit of guessing after all.  ; )  The difference is, we’re willing to take action only based on the market’s behavior.  And we’re willing to admit we’re wrong and get back in if we sell or get back out if we buy.

A new high is possible if the “Great Rotation” from bonds to stocks continues, but I’d favor that we won’t go higher than the January high of 1850.84.  We stopped at 1847.50 on Weds. and tested that high and failed on Friday.  Going to a new high would just make the subsequent sell-off that much more nerve-wracking for investors on a percentage basis.

Please read my investor sentiment work from Thursday if you haven’t.  It gives you my trading strategy.  You can access those thoughts after getting the password here: Free Subscription to My Newsletter and access to my latest comments  I’ll send you back the password to the access page and the monthly newsletter in the same email.

Here’s the SP500 Index Chart: (Note that the 50 day moving average is buried under the second red line from the top as they converge.)

sp500-index-market-timing-chart-2014-02-21-close

Re-top! Will there be a higher high now or is that it?

NOTE: The Gold and 10 Year Treasury Market Charts have been posted.  See the link to the upper right.  Thanks.

Existing Subscriber code: J25

Standard Disclaimer: It’s your money and your decision as to how to invest it.

I also comment regularly on Twitter: Follow Me on Twitter

I thank Worden Brothers for the chart system I use to post these charts.  If you want to know more about the charting system I use every day, go to my “Other Resources” page here:  Other Resources   It makes it much easier to follow along with me if you can see the charts and manipulate them on your own computer, so it’s a great investment to have an excellent charting system.

Look for updates on the main chart tracking pages this week as I feel they are needed and comments via Twitter.

Copyright © 2014 By Wall Street Sun and Storm Report, LLC All rights reserved.

Posted in investment, large cap stocks, S&P 500 Index | Tagged , , , | Leave a comment

Market Timing Brief for the Gold ETF (GLD) and 10 Year Treasury Yield (TNX) Closes On 2-21-2014: Gold Stuck. Rates Stuck. Trade the Next Move.

A Market Timing Report based on the 2-21-2014 Close published Sunday February 23, 2014

Gold and interest rates got stuck this past week.  Watch which way this pair moves from here.  Rising rates were thought to represent a good sign for the economy.  The idea is that the Fed can back off their QE buying program if the jobs situation is improving AND inflation is contained.  The move up in commodities suggests that there is pricing pressure rising in the economy and if the Fed is too slow to withdraw stimulus because it’s focused on jobs, inflation will get out of hand.  The Fed has almost always acted too late to make the changes that needed to be made.  They are horrible at predicting where the economy is going except over very short time frames.

So whereas the market was previously seeing higher rates as a POSITIVE sign, it now could find it to be a negative.  Rates may be going up because the bond market believes the Fed will be too dovish and allow inflation to get out of hand.  In that case, we could see rates up along with gold and silver, and stocks could sell off.  Even if stocks rise slowly, they may end up losing investors money due to inflation.  In other words, the after inflation returns on stocks could be negative.  We are not there yet,  however as inflation remains contained despite the fact that it is rising toward the Fed target.

The bottom line?  We will follow the charts, not the theories.  It will work out best simply to trade the next move.  You can see that there are complex crosswinds developing in the economy between the Fed, foreign currency interventions, inflation and concerns about unemployment particularly in the U.S. where that is a 50% driver of monetary policy.

Here’s the GLD chart:

gld-gold-etf-market-timing-chart-2014-02-21-close

Gold rally is intact but could be pressured by rates/the US dollar.

Ten Year Treasury Note Chart (TNX):

tnx-10-year-treasury-note--market-timing-chart-2014-02-21-close

Rates are at a decision point.

To keep up with my latest thoughts on gold and interest rates on my access page, you’ll need the password, which you can get here:

Free Subscription to My Newsletter and Access Page

(existing subscriber code: J22)

Standard Disclaimer: It’s your money and your decision as to how to invest it.

Follow Me on Twitter Here

I thank Worden Brothers for the chart system I use to post these charts.  If you want to know more about the charting system I use every day, go to my “Other Resources” page here:  Other Resources   It makes it much easier to follow along with me if you can see the charts and manipulate them on your own computer, so it’s a great investment to have an excellent charting system.

Look for updates on the main chart tracking pages this week as I feel they are needed and comments via Twitter.

Copyright © 2014 By Wall Street Sun and Storm Report, LLC All rights reserved.

Posted in Bonds, gold, investment, metals, Treasuries | Tagged , , , , , , | Leave a comment

Market Timing Brief for the Gold ETF (GLD) and 10 Year Treasury Yield (TNX) Closes On 2-14-2014: The Gold Bull Lives and Rates Are Stuck

A Market Timing Report based on the 2-14-2014 Close published Sunday February 16th, 2014

There is a new Bull market in gold and silver.  We made the exact progress hoped for in last week’s report, with GLD now above the lowest aqua resistance line.  The rally is finally on for the gold bugs.  (I mentioned on Twitter why I bought silver (SLV) instead of gold at lower levels.  There was a lag at first, but silver started catching up at the end of the week as Tweeted.)  The main headwind for gold will be interest rates (TNX, TLT, TBT) and the value of the US dollar, which are intertwined.  If rates move over the immediate overhead resistance line (green line in the 2nd chart below), gold will be under pressure.

Here’s the GLD chart:

gld-gold-etf-market-timing-chart-2014-02-14-close

Gold breakout is strong for now.

Ten Year Treasury Note Chart (TNX):

tnx-10-year-treasury-note--market-timing-chart-2014-02-14-close

Rates are off their lows and hesitating at resistance.

To keep up with my latest thoughts on gold and interest rates on my access page, you’ll need the password, which you can get here:

Free Subscription to My Newsletter and Access Page

Standard Disclaimer: It’s your money and your decision as to how to invest it.

Follow Me on Twitter Here

I thank Worden Brothers for the chart system I use to post these charts.  If you want to know more about the charting system I use every day, go to my “Other Resources” page here:  Other Resources   It makes it much easier to follow along with me if you can see the charts and manipulate them on your own computer, so it’s a great investment to have an excellent charting system.

Look for updates on the main chart tracking pages this week as I feel they are needed and comments via Twitter.

Copyright © 2014 By Wall Street Sun and Storm Report, LLC All rights reserved.

Posted in Bonds, gold, investment, metals, Treasuries | Tagged , , , , , , | Leave a comment

Market Timing Brief for the SP500 Index Close on 2-14-2014: Post Valentine Kiss of the Top?

A Market Timing Report based on the 2-014-2014 Close published Saturday February 15th, 2014

The SP500 Index (SPX, SPY) held the second level of support pointed out two weeks ago and bounced strongly.  Very likely TOO strongly.  We are almost back testing the prior high and that could send us back into another deeper correction sooner rather than later.  That’s the “Kiss the Top and Go Down” scenario.  The white line near the top of the chart below is the next target if the prior top does not hold the rally (target is at about 1888 right now).

But those are just two possibilities.  Please review the other possible scenarios for the next few months including where the next correction could kick in.  The chart posted there tells the story.  You can access my thoughts after getting the password here: Free Subscription to My Newsletter and access to my latest comments  I’ll send you back the password to the access page and the monthly newsletter in the same email.

Here’s the SP500 Index Chart:

sp500-index-market-timing-chart-2014-02-14-close

Will it surpass the last high or kiss the top and die?

NOTE: The Gold and 10 Year Treasury Market Charts will be posted by tomorrow in a single post.  Be sure to check your junk box if you don’t get it and white-list the sending address by adding it as a contact in your email system.  Thank you.

Standard Disclaimer: It’s your money and your decision as to how to invest it.

I also comment regularly on Twitter: Follow Me on Twitter

I thank Worden Brothers for the chart system I use to post these charts.  If you want to know more about the charting system I use every day, go to my “Other Resources” page here:  Other Resources   It makes it much easier to follow along with me if you can see the charts and manipulate them on your own computer, so it’s a great investment to have an excellent charting system.

Look for updates on the main chart tracking pages this week as I feel they are needed and comments via Twitter.

Copyright © 2014 By Wall Street Sun and Storm Report, LLC All rights reserved.

Posted in investment, large cap stocks, S&P 500 Index | Tagged , , , | Leave a comment

Market Timing Brief for the Gold ETF (GLD) and 10 Year Treasury Yield (TNX) Closes On 2-07-2014: Gold About to Break Out? Will Yields Continue Down?

A Market Timing Report based on the 2-07-2014 Close published Sunday February 9th, 2014

The yellow trend resistance line on the GLD chart I pointed out last Sunday was finally broken to the upside, but the top aqua resistance line must still be conquered by the gold Bulls.

Here’s the GLD chart:

gld-gold-etf-market-timing-chart-2014-02-07-close

Gold is just itching to break out.

NOTE: Breakout number is 122.51 not 122.50.

As the chart below shows, the all important 10 Year Treasury Note yield (TNX, TLT) is rising a bit again.  As you can see, gold does not always inversely correlate with the yield chart, but it has since October, move by move.  If the yield keeps rising, this could prevent a breakout in gold above the aqua line in the 1st chart.  I would check the interest rate chart before buying a gold breakout and if it’s moving WITH rather than AGAINST gold, watch your stops and make them tight or you may decide to wait a bit!  In other words, we want gold to go UP and interest rates to head DOWN, or to understand why the correlation has changed from the latest one, which is an INVERSE correlation.

tnx-10-year-treasury-note-vs-gold-market-timing-chart-2014-02-07-close

The 10 Year Treasury Yield has moved against GLD since October.

To keep up with my latest thoughts on gold and interest rates on my access page, you’ll need the password, which you can get here:

Free Subscription to My Newsletter and Access Page

Standard Disclaimer: It’s your money and your decision as to how to invest it.

Follow Me on Twitter Here

I thank Worden Brothers for the chart system I use to post these charts.  If you want to know more about the charting system I use every day, go to my “Other Resources” page here:  Other Resources   It makes it much easier to follow along with me if you can see the charts and manipulate them on your own computer, so it’s a great investment to have an excellent charting system.

Look for updates on the main chart tracking pages this week as I feel they are needed and comments via Twitter.

Copyright © 2014 By Wall Street Sun and Storm Report, LLC All rights reserved.

Posted in Bonds, gold, investment, metals, Treasuries | Tagged , , , , , | Leave a comment

Market Timing Brief for the SP500 Index Close on 2-07-2014: The Bounce

A Market Timing Report based on the 2-07-2014 Close published Saturday February 8th, 2014

The SP500 Index (SPX, SPY) has completed what could be called an A-B-C correction, which was comprised by one wave down, followed by a B consolidation move (sideways), and then the C wave down to the low this past week.

In just two days, we reversed at the lower target I had from last week (note how the market reversed at that double red line support area I pointed out last Sunday).  Why didn’t it stop and rally just below the 50 day moving average (curved aqua line on the chart below)?  Because the services ISM number was much lower than the expected, coming in just above 50 when it was predicted to be in high 50’s.  The economy is definitely slowing.  There is no question of that.  The question is whether this means 3 vs. 3.5% growth for the US in 2014 or something much lower.  That is the debate the Bulls are having with the Bears.

The Friday employment number was bad, but not that bad, so the market continued the rally it had already started on Thursday as I believed it would from the 1743 area.  This took us to 1797.02, fairly close to the round number of 1800, which the market sometimes is attracted to, but a bit farther from first technical resistance at the 50 day moving average, now at 1809.35. 

Please review my notes on the “Access page” (see below for link), but in brief I believe the rally could fail anywhere between Friday’s close and a lower high above the 50 day moving average.  A complete retopping of the market or (if the news improves substantially), a marginally higher high could occur, but I do not believe the sell-off will end before we at least retest and likely exceed the low just reached.  That also means it could fail right at the 50 day moving average itself.  I will be lowering my equity exposure as necessary.  Be sure to follow my Tweets on Twitter so you can read the very latest updates.

In my opinion, the final low in this correction will be 10-15% below the high we reach on this bounce.  The thing that can change that is a big shift of the news flow to the positive, which might include significant central bank action to shore up the emerging market banking picture.

SP500 Index Chart:

sp500-index-market-timing-chart-2014-02-07-close

The SP500 is bouncing but how high?

“Time compression”  is about to occur again I believe as I discuss in my “Access” page post this past Thursday.  Sentiment shifts are happening fast.  Be sure to read it.  We could be just days from the next fall in the market as discussed.  It lays out my thoughts about the trajectory of the market.  You can access my thoughts after getting the password here: Free Subscription to My Newsletter and access to my latest comments  I’ll send you back the password to the access page and the monthly newsletter in the same email.

NOTE: The Gold and 10 Year Treasury Market Charts will be posted by tomorrow in a single post.  Be sure to check your junk box if you don’t get it and white-list the sending address by adding it as a contact in your email system.  Thank you.

Standard Disclaimer: It’s your money and your decision as to how to invest it.

I also comment regularly on Twitter: Follow Me on Twitter

I thank Worden Brothers for the chart system I use to post these charts.  If you want to know more about the charting system I use every day, go to my “Other Resources” page here:  Other Resources   It makes it much easier to follow along with me if you can see the charts and manipulate them on your own computer, so it’s a great investment to have an excellent charting system.

Look for updates on the main chart tracking pages this week as I feel they are needed and comments via Twitter.

Copyright © 2014 By Wall Street Sun and Storm Report, LLC All rights reserved.

Posted in investment, large cap stocks, S&P 500 Index | Tagged , , , | Leave a comment

Market Timing Brief for the SP500 Index Close on 1-31-2014: At a Pivot Point

A Market Timing Report based on the 1-31-2014 Close published Sunday February 2nd, 2014

The SP500 Index (SPX, SPY) has stabilized after testing near the second level of support, which is 1767.99, the December low.  I believed the market would hold this support on Friday, so I bought the 2X version SSO at the open and sold for a decent profit at day’s end.  So you can trade those sorts of moves, but be careful about investing in them in too big of a way.  Why?  Because these support levels are pivot points.  The market can turn up or down from here.  Although I’m leaning toward an upward bounce from here before the next major move down, I could be wrong, most importantly, because some blow up could occur in the emerging markets to throw off the course of US market sentiment.

Next support is at about 1743 as of the close Friday. (intersecting red lines on chart)

SP500 Index Chart:

sp500-index-market-timing-chart-2014-01-31-close

SP500 Index at support.

I discovered an interesting phenomenon in my sentiment coverage this week, namely, that of “time compression.”  I covered my thoughts on investor sentiment for free subscribers by posting it last Thursday.  Be sure to read it.  It lays out my thoughts about the trajectory of the market over the next few weeks.  You can access my thoughts after getting the password here: Free Subscription to My Newsletter and access to my latest comments  I’ll send you back the password to the access page and the monthly newsletter in the same email.

Standard Disclaimer: It’s your money and your decision as to how to invest it.

I also comment regularly on Twitter: Follow Me on Twitter

I thank Worden Brothers for the chart system I use to post these charts.  If you want to know more about the charting system I use every day, go to my “Other Resources” page here:  Other Resources   It makes it much easier to follow along with me if you can see the charts and manipulate them on your own computer, so it’s a great investment to have an excellent charting system.

Look for updates on the main chart tracking pages this week as I feel they are needed and comments via Twitter.

Copyright © 2014 By Wall Street Sun and Storm Report, LLC All rights reserved.

Posted in investment, large cap stocks | Tagged , , , | Leave a comment

Market Timing Brief for the Gold ETF (GLD) Close On 1-31-2014: Metals Rally Falters

A Market Timing Report based on the 1-31-2014 Close published Sunday February 2nd, 2014

The resistance line I pointed out last Sunday in fact held gold (GLD) back. Gold failed to respond to rates falling further this past week, easing back on Thursday and Friday.  Support must hold, even if tested, at 119.11.  Until then, the rally is still intact.

Here’s the chart:

gld-gold-etf-market-timing-chart-2014-01-31-close-HP

Gold fails to rally on rates falling toward the end of the week.

To keep up with my latest thoughts on gold on my access page, you’ll need the password, which you can get here:

Free Subscription to My Newsletter Out Sunday Night

Standard Disclaimer: It’s your money and your decision as to how to invest it.

Follow Me on Twitter Here

I thank Worden Brothers for the chart system I use to post these charts.  If you want to know more about the charting system I use every day, go to my “Other Resources” page here:  Other Resources   It makes it much easier to follow along with me if you can see the charts and manipulate them on your own computer, so it’s a great investment to have an excellent charting system.

Look for updates on the main chart tracking pages this week as I feel they are needed and comments via Twitter.

Copyright © 2014 By Wall Street Sun and Storm Report, LLC All rights reserved.

Posted in gold, investment, metals | Tagged , , | Leave a comment

Market Timing Brief for the 10 Year Treasury Note Yield (TNX) Close on 1-31-2014: Rates Keep Falling

A Market Timing Report based on the 1-31-2014 Close published Sunday February 2nd, 2014

The 10 Year Treasury yield did in fact breach 2.819% at the 1-13-2014 low.  Housing and REITs did celebrate, but the metals did not, with both gold and silver slipping, the latter dissolving all gains, falling to recent support.  This is new and it’s not a great omen for the metals either.  With rates down, metals should be advancing.  Perhaps they still will, but at the moment, they are not and real estate is looking better.  Gold advanced with the US dollar (which did rally this week) when Europe was panicking.

Remember that stocks are depending on a continued flow of dollars out of bonds, which has been called “The Great Rotation.”  With bonds rallying again, that pressure is hardly there, another problem for stocks over the intermediate term (see the SP500 Index Chart; link to upper left).

The interest rate chart for the 10 Year U.S. Treasury Note:

tnx-10-year-treasury-note-market-timing-chart-2014-01-31-close

Rates still falling.

Please keep up with my latest thoughts about the markets on the access page on the main website.  Get the password here: Free Subscription to My Newsletter

Standard Disclaimer: It’s your money and your decision as to how to invest it.

Follow me on Twitter here:  Follow Me on Twitter

I thank Worden Brothers for the chart system I use to post these charts.  If you want to know more about the charting system I use every day, go to my “Other Resources” page here:  Other Resources   It makes it much easier to follow along with me if you can see the charts and manipulate them on your own computer, so it’s a great investment to have an excellent charting system.

Look for updates on Twitter: @SunAndStormInv (use Twitter link to right)

Copyright © 2014 By Wall Street Sun and Storm Report, LLC All rights reserved.

Posted in Bonds, investment, Treasuries | Tagged , , | Leave a comment