Market Timing Brief for the Gold ETF (GLD) Close on 11-22-2013: Gold Support Broken

A Market Timing Report based on the 11-22-2013 Close published Sunday November 24th, 2013

Under the pressure of rising interest rates, gold is breaking down again as the chart shows below.  It is a Bear market.  No buy there.  Wait until support forms.
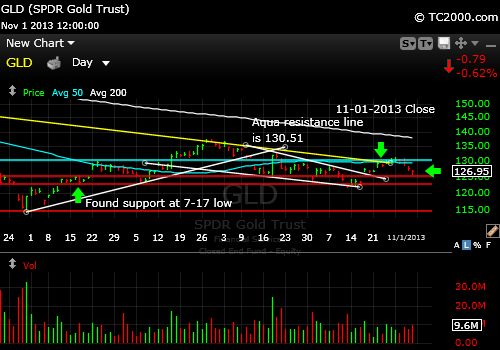
Here’s the chart:

gld-gold-etf-market-timing-chart-2013-11-22-close

Gold broke support and is falling again.

To keep up with my latest thoughts on gold on my access page, you’ll need the password, which you can get here:

Free Subscription to My Newsletter

Standard Disclaimer: It’s your money and your decision as to how to invest it.

Follow Me on Twitter Here

I thank Worden Brothers for the chart system I use to post these charts.  If you want to know more about the charting system I use every day, go to my “Other Resources” page here:  Other Resources   It makes it much easier to follow along with me if you can see the charts and manipulate them on your own computer, so it’s a great investment to have an excellent charting system.

Look for updates on the main chart tracking pages this week as I feel they are needed and comments via Twitter.

Copyright © 2013 By Wall Street Sun and Storm Report, LLC All rights reserved.

Posted in investment, metals | Tagged , , | Leave a comment

Market Timing Brief for the 10 Year Treasury Note Yield (TNX) Close on 11-22-2013: Back Up in the Channel

A Market Timing Report based on the 11-22-2013 Close published Sunday November 24th, 2013

The 10 Year Treasury yield is rising a bit.  The Fed may just keep it range bound between the prior low and 3.0%ish for now.  Rising rates have clobbered the metals including gold and silver this week (see the link to the right to the gold chart).

Here is the interest rate chart for the 10 Year Treasury Note:

tnx-10-year-treasury-note-market-timing-chart-2013-11-22-close

Rates rising a bit within a range.

Please keep up with my latest thoughts about the markets on the access page on the main website.  Get the password here: Free Subscription to My Newsletter

Standard Disclaimer: It’s your money and your decision as to how to invest it.

Follow me on Twitter here:  Follow Me on Twitter

I thank Worden Brothers for the chart system I use to post these charts.  If you want to know more about the charting system I use every day, go to my “Other Resources” page here:  Other Resources   It makes it much easier to follow along with me if you can see the charts and manipulate them on your own computer, so it’s a great investment to have an excellent charting system.

Look for updates on the main chart tracking pages this week as I feel they are needed and comments via Twitter.

Copyright © 2013 By Wall Street Sun and Storm Report, LLC All rights reserved.

Posted in Bonds, investment, Treasuries | Tagged , , | Leave a comment

Market Timing Brief for the SP500 Index Close on 11-15-2013: One More Push?

A Market Timing Report based on the 11-15-2013 Close published Sunday November 17th, 2013

This week we end up needing to discuss that white line from last week again.  That’s the target in the chart below, somewhere around 1823 at the moment and it rises higher if we consolidate our gains first.  If we make it there quickly, it could limit the gains for a bit, unless as I said, the market consolidates first.   Maybe we’ll have some excuse come up for a correction.

We stretched above the prior channel (yellow line is the top of the prior channel), and we are now going to hit the top of the monthly channel, which is the white line.

I am going to cover my thoughts on investor sentiment on the WSSSR Access page on the main site by the morning’s open, which you can subscribe to here: Free Subscription to My Newsletter and access to my latest comments  I’ll send you back the password to the access page in the same email.  You definitely want to read it.  My last post on Friday tells you how I’m investing now, how much in stocks, gold, etc.  It will help you think about your own portfolio and how to organize it.

sp500-index-market-timing-chart-2013-11-15-close

SP500 Index has at least one more push left.

Standard Disclaimer: It’s your money and your decision as to how to invest it.

I also comment regularly on Twitter: Follow Me on Twitter

I thank Worden Brothers for the chart system I use to post these charts.  If you want to know more about the charting system I use every day, go to my “Other Resources” page here:  Other Resources   It makes it much easier to follow along with me if you can see the charts and manipulate them on your own computer, so it’s a great investment to have an excellent charting system.

Look for updates on the main chart tracking pages this week as I feel they are needed and comments via Twitter.

Copyright © 2013 By Wall Street Sun and Storm Report, LLC All rights reserved.

Posted in investment, large cap stocks | Tagged , , , | Leave a comment

Market Timing Brief for the Gold ETF (GLD) Close on 11-15-2013: Gold Needs to Hold Nearby Support

A Market Timing Report based on the 11-15-2013 Close published Sunday November 17th, 2013

Last week I said: “GLD  must soon find support at 122.73 or 121.85 or the extension of the lower white channel line or 114.68 (bottom red line) will be the next target.”  Gold is now above critical support, but if you look at the chart below, you’ll see that there is a high surrounded by two shoulders, one formed by one lower high to the left on the chart and the other formed by a double top at a lower high on the right that matches the height of the lower high on the left.  That’s a head and shoulders formation, which if it breaks would allow GLD to fall to about 111.  Ouch!

Here’s the chart:

gld-gold-etf-market-timing-chart-2013-11-15-close

Gold is in a bit of a dangerous place.

Gold is a bit weak in the overseas market tonight.  It’s good it held a third test at the red line.  That’s a lot of testing.  Another test is likely to break.

If GLD can hold above the 2nd red line from the bottom of the above chart, it has a shot at making a new high above the 8-27 high.

To keep up with my latest thoughts on gold on my access page, you’ll need the password, which you can get here:

Free Subscription to My Newsletter

Standard Disclaimer: It’s your money and your decision as to how to invest it.

Follow Me on Twitter Here

I thank Worden Brothers for the chart system I use to post these charts.  If you want to know more about the charting system I use every day, go to my “Other Resources” page here:  Other Resources   It makes it much easier to follow along with me if you can see the charts and manipulate them on your own computer, so it’s a great investment to have an excellent charting system.

Look for updates on the main chart tracking pages this week as I feel they are needed and comments via Twitter.

Copyright © 2013 By Wall Street Sun and Storm Report, LLC All rights reserved.

Posted in investment, metals | Tagged , , | Leave a comment

Market Timing Brief for the 10 Year Treasury Note Yield (TNX) Close on 11-15-2013: Rising Rates Stopped by Yellen?

A Market Timing Report based on the 11-15-2013 Close published Sunday November 17th, 2013

The 10 Year Treasury yield backed off its recent surge as Janet Yellen, the Fed Chair designate testifying before the Senate.  But it needs to keep falling on Monday to be entirely convincing.

Here is the interest rate chart for the 10 Year Treasury Note:

tnx-10-year-treasury-note-market-timing-chart-2013-11-15-close

Rates bobbing around, but at the moment falling again.

If you are investing in gold, you’ll need to keep an eye on this chart constantly.  If rates surprise nearly the entire market and keep falling, gold and silver will be rising again.  (see the chart from this week; to be published soon!)  Emerging markets, housing stocks and REITs will move up quickly as well.

Please keep up with my latest thoughts about the markets on the access page on the main website.  Get the password here: Free Subscription to My Newsletter

Standard Disclaimer: It’s your money and your decision as to how to invest it.

Follow me on Twitter here:  Follow Me on Twitter

I thank Worden Brothers for the chart system I use to post these charts.  If you want to know more about the charting system I use every day, go to my “Other Resources” page here:  Other Resources   It makes it much easier to follow along with me if you can see the charts and manipulate them on your own computer, so it’s a great investment to have an excellent charting system.

Look for updates on the main chart tracking pages this week as I feel they are needed and comments via Twitter.

Copyright © 2013 By Wall Street Sun and Storm Report, LLC All rights reserved.

Posted in Bonds, investment, Treasuries | Tagged , , | Leave a comment

Market Timing Brief for the 10 Year Treasury Note Yield (TNX) Close on 11-08-2013: Moving Up Fast

A Market Timing Report based on the 11-08-2013 Close published Sunday November 10th, 2013

The 10 Year Treasury yield continued moving up in a big way on Friday after the employment report.  The Fed is using employment as one of their metrics of monetary policy success, so rising rates mean the market feels the Fed will be tapering QE (Quantitative Easing) soon.

Rising rates will continue to pressure bonds and interest rate sensitive stocks as I pointed out last week to my free subscribers in the free monthly newsletter; get the password via the link below.  Rates also push hard on emerging markets that need lots of capital to keep growing fast, so I was forced to adjust my opinion quickly on when to enter them.  They do have excellent value, but short term will be pressured by rising rates.  The answer is on the website on the “WSSSR Access” page.

Here is the interest rate chart for the 10 Year Treasury Note:

tnx-10-year-treasury-note-market-timing-chart-2013-11-08-close

Interest rates are spiking pressuring metals and interest rate sensitive stocks and markets.

I believe the Fed may start to push back when rates hit the 3.0% mark or thereabouts. 

Please keep up with my latest thoughts about the markets on the access page on the main website.  Get the password here: Free Subscription to My Newsletter

Standard Disclaimer: It’s your money and your decision as to how to invest it.

Follow me on Twitter here:  Follow Me on Twitter

I thank Worden Brothers for the chart system I use to post these charts.  If you want to know more about the charting system I use every day, go to my “Other Resources” page here:  Other Resources   It makes it much easier to follow along with me if you can see the charts and manipulate them on your own computer, so it’s a great investment to have an excellent charting system.

Look for updates on the main chart tracking pages this week as I feel they are needed and comments via Twitter.

Copyright © 2013 By Wall Street Sun and Storm Report, LLC All rights reserved.

Posted in Bonds, investment, Treasuries | Tagged , , | Leave a comment

Market Timing Brief for the Gold ETF (GLD) Close on 11-08-2013: Gold Still Falling

A Market Timing Report based on the 11-08-2013 Close published Sunday November 10th, 2013

GLD  must soon find support at 122.73 or 121.85 or the extension of the lower white channel line or 114.68 (bottom red line) will be the next target.  Gold is falling because interest rates are rising and it is believed that the economic recovery is under way.  Rates rising in recovery is the expected scenario.  If rates rise too fast, inflation is contained and gold serves less of a purpose in protecting one’s wealth.  That’s the theory.

Here’s the chart:

gld-gold-etf-market-timing-chart-2013-11-08-close

GLD is in danger of another fall.

I expect GLD  to test the red line above the lowest one on the chart above by tomorrow.  GLD is down slightly in the overseas market tonight.

To keep up with my latest thoughts on my access page, you’ll need the password, which you can get here:

Free Subscription to My Newsletter

Standard Disclaimer: It’s your money and your decision as to how to invest it.

Follow Me on Twitter Here

I thank Worden Brothers for the chart system I use to post these charts.  If you want to know more about the charting system I use every day, go to my “Other Resources” page here:  Other Resources   It makes it much easier to follow along with me if you can see the charts and manipulate them on your own computer, so it’s a great investment to have an excellent charting system.

Look for updates on the main chart tracking pages this week as I feel they are needed and comments via Twitter.

Copyright © 2013 By Wall Street Sun and Storm Report, LLC All rights reserved.

Posted in investment, metals | Tagged , , | Leave a comment

Market Timing Brief for the SP500 Index Close on 11-08-2013: Re-topping

A Market Timing Report based on the 11-08-2013 Close published Sunday November 10th, 2013

With the good news of better employment figures on Friday, the SP500 Index has essentially re-topped as the chart shows below.  There is no point in buying without another breakout above the top of the range.  If there is in fact a breakout the target remains that upper white line.

Sentiment is the same as last week for individual investors.  My analysis is the same, so please get the password using the link below if you want to read it.

A correction could start from here or from that upper line.  I would doubt we’ll go sailing through that white line without further consolidation, but that would likely frustrate a lot of investors, so don’t rule it out completely.  Defend profits at some reasonable level (that’s my view, but as I like to say, “It’s your money.”)

I cover further thoughts on my access page from time to time, which you can subscribe to here: Free Subscription to My Newsletter  (I’ll send you back the password)

sp500-index-market-timing-chart-2013-11-08-close

Back to the Top. Need a breakout though.

Standard Disclaimer: It’s your money and your decision as to how to invest it.

I also comment regularly on Twitter: Follow Me on Twitter

I thank Worden Brothers for the chart system I use to post these charts.  If you want to know more about the charting system I use every day, go to my “Other Resources” page here:  Other Resources   It makes it much easier to follow along with me if you can see the charts and manipulate them on your own computer, so it’s a great investment to have an excellent charting system.

Look for updates on the main chart tracking pages this week as I feel they are needed and comments via Twitter.

Copyright © 2013 By Wall Street Sun and Storm Report, LLC All rights reserved.

Posted in investment, large cap stocks | Tagged , , , | Leave a comment

Market Timing Brief for the SP500 Index Close on 11-01-2013: Hanging Onto the Last Breakout by a Thread

A Market Timing Report based on the 11-01-2013 Close published Sunday November 3rd, 2013

The SP500 Index held above the prior breakout at 1759.33 on Friday despite slipping a bit after the Federal Reserve meeting.  That level must continue to hold or we’ll likely ease back to the top yellow line in the chart for starters.  The September high would be the next target if that level fails.  Although there is a risk of a pullback, I’d rather exit while preserving profits than exit early. 

My immediate upside target remains that upper white trend line on the chart that represents the top of the monthly upward channel line.

We are in a similar place to 7-25-2013, but must move back above the Weds. close of 1763.31 to kick back into Bull gear.  Back in July, that sort of action led to one more push up before a significant correction began.

I cover further thoughts on my access page from time to time, which you can subscribe to here: Free Subscription to My Newsletter  (I’ll send you back the password)

sp500-index-market-timing-chart-2013-11-01-close

SP500 Index slipped a bit post-Fed meeting, but is still above the last breakout.

Standard Disclaimer: It’s your money and your decision as to how to invest it.

I also comment regularly on Twitter: Follow Me on Twitter

I thank Worden Brothers for the chart system I use to post these charts.  If you want to know more about the charting system I use every day, go to my “Other Resources” page here:  Other Resources   It makes it much easier to follow along with me if you can see the charts and manipulate them on your own computer, so it’s a great investment to have an excellent charting system.

Look for updates on the main chart tracking pages this week as I feel they are needed and comments via Twitter.

Copyright © 2013 By Wall Street Sun and Storm Report, LLC All rights reserved.

Posted in investment, large cap stocks | Tagged , , , | Leave a comment

Market Timing Brief for the Gold ETF (GLD) Close on 11-01-2013: Gold Failed at Resistance

A Market Timing Report based on the 11-01-2013 Close published Sunday November 1st, 2013

GLD (now @ 126.95) made it through all three resistance lines last week and then reversed back BELOW all three.  The breakout was a fake-out or false breakout.  The close on Monday was at 130.56, which was a bit too cute, being just 0.05 points above the breakout.  Here’s the chart:

gld-gold-etf-market-timing-chart-2013-11-01-close

Gold fails at resistance after the Fed meeting.

I expect GLD  to test 125.15 and then if that does not hold, the recent low on the daily chart.

The gold weakness followed the Fed statement.  The market believes that the economy is recovering, so that less in the way of QE will be required going forward.  That means higher interest rates with the Fed stepping out of the picture.

The thing that could help boost gold (GLD) and silver (SLV)is the impression that the Fed WILL NOT be able to step out of the way without having interest rates go to prohibitive levels that would shut down the economy.   The other is rising inflation which is not in the picture at the moment.  Inflation won’t be a problem until the economy starts growing too quickly with rates still very low.

Gold will do the best if it stays above the next support level, which would define a higher low.  Otherwise the momentum it had will have been lost.

To keep up with my latest thoughts on my access page, you’ll need the password, which you can get here:

Free Subscription to My Newsletter

Standard Disclaimer: It’s your money and your decision as to how to invest it.

Follow Me on Twitter Here

I thank Worden Brothers for the chart system I use to post these charts.  If you want to know more about the charting system I use every day, go to my “Other Resources” page here:  Other Resources   It makes it much easier to follow along with me if you can see the charts and manipulate them on your own computer, so it’s a great investment to have an excellent charting system.

Look for updates on the main chart tracking pages this week as I feel they are needed and comments via Twitter.

Copyright © 2013 By Wall Street Sun and Storm Report, LLC All rights reserved.


Posted in investment, metals | Tagged , , | Leave a comment