The S&P 500 Could Break the Wedge to the Downside

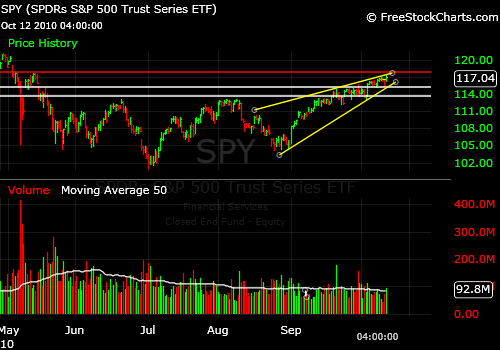
The S&P 500 broke up through the rising bearish wedge yesterday and NOW has broken back down through the top of the wedge, which constitutes the first SELL signal for traders. Do you see the red lines JUST BELOW the top line forming the wedge? That is where the market is right now.

A more significant break would be for it to now fall through the BASE of the WEDGE to the downside.
That would generate much more selling presumably.

Things have topped out here. Everything but the dollar that is. Be sure to look at the US dollar vs. Gold Chart on my blog today (link is below). It is the NEXT BIG TRADE I believe. I could be wrong, but I think the dollar is about to rally hard and leave most everything else behind.

On a practical level, you may decide to wait for a close below the wedge before you sell. Do what you feel is best for you. If it turns out, the market recovers and you have exited, you must be willing to get back in.

The breakout above the wedge in the S&P 500 has been voided (at least for now).
 
You can review my recent thinking here on THE BIG US DOLLAR TRADE:Market Timing Blog at SunAndStormInvesting.com
 
 
Click here to get my “Tips” for FREE
 
Standard Disclaimer: Remember, it’s your money and your decision as to how to invest it.

Posted in Uncategorized | Leave a comment

Positive Move by the S&P 500 this Morning

See the prior post for an explanation of the lines. Today’s chart is positive in that the upper line forming the wedge has been broken to the UPSIDE. That must hold on a closing basis of course to validate the move and the negation of the bearish rising wedge. (Chart provided courtesy of Worden Brothers, Inc. at FreeStockCharts.com.)

SPY Rising Bearish Wedge is Broken to the Upside

Falling BACK DOWN through the wedge would be VERY BEARISH, so follow this chart along with me.

Happy Investing and Trading,

David

Standard Disclaimer: Remember, it’s your money and your decision as to how to invest it.

You can review the POSITIVES AND NEGATIVE SIGNALS in the markets HERE (from today):
Market Timing Blog at SunAndStormInvesting.com

Click here to get my “Tips” for FREE

The charts were produced by FreeStockCharts.com which is a registered trademark of Worden Brothers, Inc., Five Oaks Office Park, 4905 Pine Cone Drive, Durham, NC 27707. Ph. (800) 776-4940 or (919) 408-0542. http://www.Worden.com.

Posted in Uncategorized | Leave a comment

The S&P 500 (SPY) is Forming a Bearish Rising Wedge

The wedge is formed by the two YELLOW lines converging toward the upper right on the chart (see below).

The two WHITE lines represent resistance levels the market has been able to successfully trade through to the upside.

The RED line indicates the next level of resistance at the May high prior to the “Flash Crash” of May 6, 2010. The SP500 must trade up through that level or it risks forming a lower high than the April high and coming down.

Here it is courtesy of FreeStockCharts.com by Worden Brothers, Inc.:

SPY Bearish Rising Wedge Signal

So what can happen?

The SP500 can trade up through the May high and break up through the top line forming the wedge and thereby negate the effect of the wedge

OR

it can fall back through the lower line forming the wedge and go as far as the “origin” of the wedge which would be the August low.

If the market were to break down from here, it would be supported at least briefly by the two price points indicated by the horizontal white lines.

CONCLUSION:
The SP500 has broken out above significant resistance levels, but is close to overhead resistance at the May high. Getting through the may high would likely bring the market back to the April high. Falling through the base of the wedge could bring the market as low as the August low.

Standard Disclaimer: Remember, it’s your money and your decision as to how to invest it.

You can review the POSITIVES AND NEGATIVE SIGNALS in the markets HERE (from today):
Market Timing Blog at SunAndStormInvesting.com

Click here to get my “Tips” for FREE


The charts were produced by FreeStockCharts.com which is a registered trademark of Worden Brothers, Inc., Five Oaks Office Park, 4905 Pine Cone Drive, Durham, NC 27707. Ph. (800) 776-4940 or (919) 408-0542. http://www.Worden.com.

Posted in Uncategorized | Leave a comment

Market Timing Forum™: Do you believe the breakouts in the S&P 500 and in GLD (Gold) will hold?

The question is STILL relevant today! Please add your comments about whether you believe the breakouts in the markets particularly in the S&P 500 and in GLD (GOLD) will hold or not. I’ve entered a comment below. Scroll down to read it and add your own comment. I’ll be returning to review your comments and respond on Sunday. Thanks for your input!

all the best,

Dave

Posted in Uncategorized | 2 Comments

For My Latest Comments on the Markets

For now, go HERE for My Latest Comments on the Markets:
 Market Timing Blog at SunAndStormInvesting.com

To receive FREE access to ALL my intraday comments simply subscribe for FREE to my “Tips” newsletter. A password to the “Tips” page on my website will be sent to you.
Click here to get my “Tips” for FREE
 

Please feel free to comment about issues related to technical and/or fundamental investing and trading on this Blog Page. I will reserve the right to edit or remove any posts or links that are about politics, or are in any way offensive, inappropriate, or unrelated to the discussion and to do “housekeeping” if discussions have not been updated in a long time etc.

I will not always respond myself to your questions and cannot obviously be responsible for the accuracy and quality of the responses you may get from others. So use your own common sense and always make your own investment decisions with the help of a financial advisor if needed.

I cannot give you individual investment advice and you should not expect that from others either. Thank you for your understanding. It’s your money and your decision entirely as to how to invest it. Take 100% responsibility for your investments and/or trades and you will likely do VERY VERY well. It is the secret to investment and trading success.

Posted in Uncategorized | Leave a comment

Market Timing the GLD ETF Today: How did GLD do?

Not very well really, but better than it could have. The “3rd signal” that I wrote about today that is on the website blog along with downside targets you will want to review was 121.15. The GLD market tested that down to at least 121.08 in the premarket, but then recovered to close at 121.73.

That is still below the May high of 122.24, but getting close and below the June high of 123.56.

Right now GLD looks like it’s in a consolidation after the 9-9-2010 pullback. The action is not “lethal” unless GLD gives way to the third SELL signal 121.15. A move below there that holds on a close will bring gold down to our next target.

In summary, gold could either go either way in the short term. Long term positions should still be held in my view, while trading positions are being tested at resistance on the chart.

Standard Disclaimer: Remember, it’s your money and your decision as to how to invest it.

You can review the downside targets for GLD here:Market Timing Blog at SunAndStormInvesting.com

Click here to get my “Tips” for FREE

Posted in Uncategorized | Leave a comment

Hello Investors and Market Timers!

Posted in Uncategorized | 1 Comment