A Market Timing Report based on the 5-03-2013 Close published Sunday May 5th, 2013
UPDATE 5-9-2013 @ 2:29 pm ET: The SP500 Index is now above the wedge previously discussed no matter how you draw it. The Bears need a break down back through the top of the wedge to start salivating. Otherwise we go higher in my opinion. We are also in the second week of trading above the 2007 high (non-inflation adjusted).See the chart:

SP500 Index now above the wedge.
I thank Worden Brothers for the charting system. If you want to know more about the charting system I use every day, go to my “Other Resources” page here:
My Chart Source
And now for this week’s text:
Yes it could and I’ll share the “why.” Markets sometimes make new nominal highs (meaning non-inflation adjusted highs) and then reverse the breakouts. The 2000 high for the SP500 Index (SPX, SPY) was 1552.87 and the 2007 high was 1576.09 intraday. Of course we saw a massive collapse from that 2007 high. This is the chart of the past 13 years:
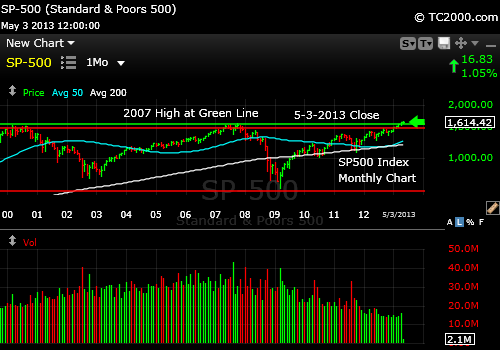
SP500 Index Monthly Chart showing the climb back to the 2007 high.
You can see a difference between the 2003-2006 period and the recent 2009-2012 period. There was much more volatility over the past few years than during the prior recovery, because of all the repercussions around the world of the financial crisis, particularly in Europe. Notice how the depths of the 2010 and 2011 corrections were much greater compared to the corrections since that time? Volatility has gone down as confidence in the future has risen.
Now it is “easier” for investors to invest in stocks knowing that the markets did recover, except for the few firms like Lehman Brothers that went bankrupt during the crisis. A notable company that was saved by the US government in an effort to stabilize the system by stealing from savers was AIG, which essentially was a root cause of the crisis. AIG has been attempting to SUE the government for money. Amazingly ungrateful people run that company apparently. If people had taken ALL of their savings when QE started and put it into stocks, they would have done much better than staying in cash. That is what investors learned from all this. Not necessarily the wisest risk management strategy, but it has worked so far in what some call the “Bernanke Bubble.”
Next see the daily Sp500 Index chart at the following link:
Market Timing Charts for Sunday’s Issue (opens separate window for access to all charts)
And I’d like you to pull the weekly chart up from here:
Weekly SP500 Chart is Second Chart
On that chart, we are now at the top of the wedge shown that I’ve been talking about lately and although it is positive that we’ve made a new high and continue to rise above the 2007 high, we must break UP out of that wedge to negate it. If we break down through that bottom white line on the chart, there will be $$$$ to pay.
What about sentiment? Investor sentiment did not shift that much from last week, with the AAII Survey showing the Bull Bear spread moving from -10.5% to -4.9%. Bears only dropped about 3% and Bulls only rose about 3%. That allows for more Bulls to show up before the next significant pullback. Remember, investors were inappropriately BEARISH as we tested the 2007 high. Once they gain more confidence, we may see the next blip down or correction. So far, every blip has been bought by the thirsty Bulls.
What about valuations? They are about at fair value, but are still undervalued compared to prior highs in the markets including tech and non-tech and small and large cap stocks, so what it will take to make more upside progress in stocks is to have more buyers come in. If no new buyers show up, we’ll stall out from 35,000 feet. As I’ve mentioned recently, the current trend is that investors who were previously avoiding stocks completely have shifted to a blended approach, putting new money in both bonds and stocks. That may be the fuel that carries the market higher.
What about the economy? As Twitter followers noticed, I did some substantial buying before the pop up on Friday, because I saw that the combination of a positive ADP employment report and the lower unemployment weekly claims number would mean a better overall employment number on Friday and it was. It was the first time that the overall employment number did not drop mainly because of a falling participation rate, meaning people dropping out of the work force. The number was better, because hiring was better, which is what we all want. That brought the rate of unemployment down a bit to 7.5%, which is now 1% from the goal of the Fed’s policy to achieve 6.5% unemployment and inflation below 2.5%.
Dr. B. is leaving, have you heard? Bernanke has telegraphed that someone else can do what is needed to get the economy off his crack cocaine monetary policy. No one knows what will happen when they start withdrawing the drug, because it’s never been done before. The unavoidable consequence will be higher interest rates, which at some point will pressure stocks. The question is whether the Fed Reserve will move first and rates will rise or whether rates will rise and the Fed will be forced to follow. They have to follow interest rates up eventually and raise the Fed funds rate or they essentially are using the government to feed free cash to banks, which has been what they have been doing all along. It is just more blatant when the Fed’s money costs the banks 0.5% and they can lend it for 5% vs. 3.5% now. That the savers of this country have not revolted is absolutely amazing. That is how skillful Dr. B and cohorts have been in mesmerizing our people.
Things are likely to get more expensive over the next decade as the sources of cheap labor are drying up more and more over time. The Chinese and Indians are not going to work for next to nothing forever. These nations have been controlling their population growth, which will add to the labor shortage. Take a look at aging Japan, with fewer and fewer people working to service the aged population. If costs go up, rates will have to go up. Luckily for us, the Fed cannot ignore their second mandate of keeping inflation low. They can play monetary games that may end up in a future inflationary disaster, but if inflation rises, they’ll have to put the fire out by raising rates, because that is in their job description.
The one bit of good news on costs is that energy costs are likely to go DOWN over the decade as the US becomes a net exporter of energy due to the massive discoveries being made. What will the balance be? For that, we need to follow Treasuries and gold.
The 10 Year Treasury (TNX, TLT) is signaling the go ahead for the “Great Rotation” from bonds into stocks. Corporate bonds plummeted on Friday as the Ten Year yield skyrocketed from the low it had reached on Thursday. There is plenty of room for a TWO MONTH rally in stocks based on the bond selling according to where the 10 Year Treasury is trading. This means pain for bonds and love for stocks. And that brings us to the end of June or early July, so the “going away” may be delayed this year. Take a look at the stats I shared last week about when to “go away.” It’s not always in May and it does not always work. (The stats are on the blog in last week’s post if you missed them.)
The chart at the link above shows how the 10 Year Treasury is bouncing now, endangering bond fund returns.
Gold bounced the “usual” amount as I explain at the GLDTracker™ link above.
You may as well flip a coin at this point to determine its next direction based on the gold chart itself. If you know me, you would know that I would then look to other markets for clues as to what gold will do. If interest rates continue to rise back up from here as I suspect they will, gold will be retesting its recent low at least. Gold will be under pressure as long as positive real interest rates are a reasonable possibility and they will be in a recovering economy. The Bulls can say, “But the central banks continue to print money” and that is true, but until gold acts like the excess money is going to cause real inflation that rises FASTER than interest rates, gold will not be off to the races.
The long term signals are out today in the MTT table below (available only to free subscribers). The only negative long term signals are gold, gold stocks, commodities, short term bonds, and Canadian stocks (not surprising given bias toward resources).
Key Takeaways for the Week:
1. The SP500 Index is up against a wedge that it must break up and out of or it will be “go away” time.
2. Stocks are not overvalued vs. prior highs.
3. Investor sentiment has room to be more Bullish which allows for more gains in stocks.
4. Gold is a crap shoot at these levels (or worse as #5 suggests).
5. Interest rates are likely rising near term which could hurt bonds and gold.
Have a great week investing and/or trading!
Standard Disclaimer: It’s your money and your decision as to how to invest it.
The above is the text from this week’s free report. To receive future reports ahead of publication of the text shown above AND much more market timing information, please subscribe for free here:
Free Subscription to My Weekly Newsletter
If you “liked” this post, would you please “Like” it at the “Share” arrow below? Thanks very much!
And to follow my Buys and Sells and up to the minute insights, please follow and bookmark my Twitter feed here: Join Me on Twitter
Copyright © 2013 By Wall Street Sun and Storm Report, LLC All rights reserved.
