A Market Timing Report based on the 8-01-2014 Close, published Saturday August 3rd, 2014
Did earnings or the Fed bring small caps back down so dramatically? Both. Small cap (RUT, IWM) valuations were stretched, and the bounce back was not warranted. Add in the Fed lowering QE another notch with strong employment suggesting that rates will go up sooner rather than later and the market believes valuations could drop. That’s done in two ways: earnings go up or stock prices go down. With slower growth over the 1st half of the year, the prospects for rapidly growing earnings are low, so a falling stock market is the alternative.
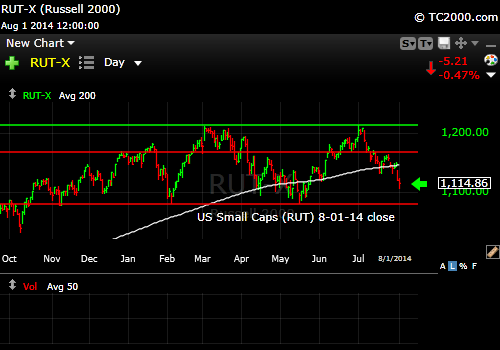
Small cap rally was cut short early after further QE tapering and strong employment.
You’ll note in the chart above that the small caps still have a 1-3 days of falling to do in order to reach obvious support. That lower red line is like a magnet for stock prices, although at times one index does find support before another and helps to rally the entire market. There is a long term sell signal among the small caps that just emerged on a closing basis for the month of July. Not good.
In the chart below, you can see that this could happen for the SP500 Index in just a day or two, or even be completed on one fine Monday morning in August. Either the red support line shown or the yellow up channel line could provide support for a bounce. We nibbled on Thursday’s fall, but may have been a bit early…
…for further comments on the charts below and more, please gain free access here: Free Subscription to My Newsletter and access to My Latest Comments/Strategy
Here’s the SP500 Index Chart (SPX, SPY; click to enlarge):
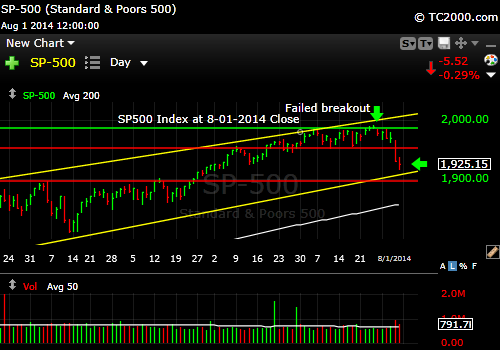
SP500 Index failed at first support.
The Gold ETF Chart (GLD; click to enlarge the chart):
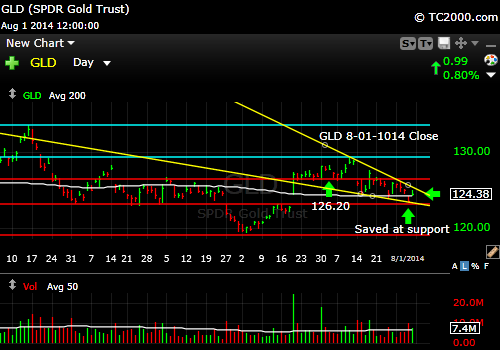
Gold is in a downward wedge, which is Bullish.
The 10 Year Treasury interest rate (TNX, tracked by TLT if Bullish; TBT if Bearish): Rates are still low despite the Fed’s tapering of QE.
Here’s the chart (click to enlarge):
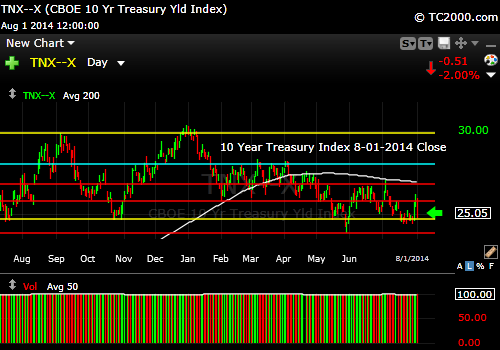
Rates land near the bottom of their range.
Don’t miss out on my comments on Twitter® or StockTwits® where my buys and sells are posted. You can read my Tweets whether you have a Twitter account or not: Follow Me on Twitter®. Follow Me on StockTwits®.
Standard Disclaimer: It’s your money and your decision as to how to invest it.
I thank Worden Brothers for the charting system I use to post these charts. If you want to know more about the charting system I use every day, go to my “Other Resources” page here: Other Resources It makes it much easier to follow along with me if you can see the charts and manipulate them on your own computer. It’s a great investment to have an excellent charting system. Check it out with a free trial at the link above.
Copyright © 2014 By Wall Street Sun and Storm Report, LLC All rights reserved.
