A Market Timing Report based on the 8-08-2014 Close, published Saturday August 10th, 2014
We started buying a bit early and then bought more aggressively in the U.S. large cap (SPX, SPY) and mid-cap markets (MID, IJH, MDY) as well as doing selective buying in the emerging markets (see my messages: Follow Me on Twitter®. Follow Me on StockTwits®.). I am still avoiding the U.S. small caps on valuation concerns (RUT, IWM), although I do expect them to bounce along with large and mid-caps.
Here’s the SP500 Index Chart (SPX, SPY; click to enlarge):

SPS500 Index finding support now?
The SP500 bounced from a point very close to the up trend line shown in yellow in the chart above. It rose above the range of the prior two days of trading and above the 5 day moving average, which is a measure of the short term trend. It was claimed that the bounce was mainly due to what I have dubbed “Russian Resolution Risk,” which is simply the risk to the Bears that Putin backs off of taking over the Ukraine, or at least his perceived desire to do so. Troops were moved from the border following the Tweet from the RIA about a quote from the chief of the Russian Security Council: Russian Tweet that Moved Markets. Why should that matter? Because the European economy is already faltering and adding the Russian mess to it just complicates things further. I’m favoring the better markets around the world and leaving some of the generic indices that include trouble spots like Italy, which is back in a shallow recession, which could worsen.
Where could this rally fail? We could see an SP500 Index failure at the top red line in the above chart. It’s at the base of the prior top formation in the market, and it coincides with the 50 day moving average (mav) – at least it’s close to it. I believe the SP500 will test the 200 day mav or thereabouts if the 50 day mav acts as a barrier.
…for all of my allocations across the world, please gain free access here: Free Subscription to My Newsletter and access to My Latest Comments/Strategy with Market Allocations Worldwide
We have re-entered the gold market (subscribe above to see how much we put in; see “Access Page”). We maintain a long term hold position, but trade a position in GLD as well.
The Gold ETF Chart (GLD; click to enlarge the chart):

Gold is back in rally mode but with overhead resistance.
The chart above shows a downward wedge being broken to the upside, which is very Bullish. The goal post for the first move is the horizontal aqua line, and the top aqua line would be very possible after that. There could be some pressure on gold if the world settles down further and European banking fears abate. But the simple key is real interest rates as I’ve explained multiple times, which is the difference between the current rate on 10 Year Treasury Notes, for example, and inflation. As long as yields are as low as they are, gold is attractive because inflation is outrunning the return on the notes. We need to closely monitor inflation going forward. I suspect the U.S. Fed will remain behind the curve, which will help gold, but if it is perceived that the OPPOSITE is true, gold will suffer. Rising rates makes dollars more sought after and can bring gold down for example.
The 10 Year Treasury interest rate (TNX, tracked by TLT if Bullish; TBT if Bearish): Bottom Reached?
It does look like the latest rally in rates may be over. Time to lock in those rates! There was a significant reversal above the May low after a test below it on Friday. The line is in the sand. Rising rates would help financials but hurt other interest rates sensitive areas of the market, such as REITs and utilities.
Here’s the chart (click to enlarge):
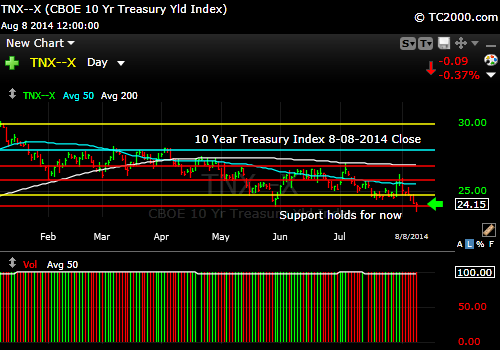
Rates may have bottomed.
Standard Disclaimer: It’s your money and your decision as to how to invest it.
I thank Worden Brothers for the charting system I use to post these charts. If you want to know more about the charting system I use every day, go to my “Other Resources” page here: Other Resources It makes it much easier to follow along with me if you can see the charts and manipulate them on your own computer. It’s a great investment to have an excellent charting system. Check it out with a free trial at the link above.
Copyright © 2014 By Wall Street Sun and Storm Report, LLC All rights reserved.

Loved reading this thankk you