A Market Timing Report based on the 8-15-2014 Close, published Sunday August 17th, 2014
We sold some U.S. stock market exposure including mid and large caps at the end of the week after making a nice short term profit. I like to do a quick seat-of-the-pants calculation of a simple annualized (no compounding) return taking into account the gain/loss and the number of days in the stock or index. For the midcaps (MID, MDY, IJH) we bought and sold, the annualized gain was 80.1%, and for the SPX it was 29.49%, as we went in earlier in the case of the SPX (SPY). The raw gains were 1.76% and 1.01% after 8 and 12.5 days on average in each of the respective trades.
We raised some cash and are waiting for lower prices, which likely will come. The risk of being a bit less exposed to the market (by around 17% of max. equity exposure) is that we could miss out on what I call “resolution risk.” Things are changing rapidly with wars starting and stopping each week! Another negative? Individual investor sentiment predicts lousy returns in the near term (see link at bottom of this article).
Follow Me on Twitter®. Follow Me on StockTwits®
Here’s the SP500 Index Chart (SPX, SPY; click to enlarge):

SP500 Index could pause here and pull back again.
Last week I said the SPX could stop at the upper red line shown in the above chart. It did. We sold some exposure to both large and mid cap U.S. stocks based on that failure to rise above the resistance line or the 50 day moving average, which are almost coinciding now. It could just be a pause on the way up, but geopolitics will probably influence the chart very directly, very quickly. The SP500 Index could easily fall back and retest that lower yellow channel line in the chart above.
Meanwhile, what do the small caps show (RUT, IWM)? They remained below the 200 day moving average. The buying looks weak, but I must admit that a higher low has formed on the daily chart, which is a plus. Small caps are still overvalued in my opinion, particularly given the slowing of worldwide economic growth.

Small caps still look weak.
Gold FELL despite the drop in real interest rates that occurred when the 10 year Treasury yield plunged. Inflation is just under 2% now with returns in banks close to zero. People are losing money in the bank, which should cause gold to rally strongly. I think some of the selling may have been a reflex move due to the moderation of tough talk by Russia. The Ukraine government was able to demolish a Russian military deployment in their territory without igniting a world war. That act alone was taken very badly by the market initially, but it then came back to flat. This tells me there are still buyers of stocks. You can see also that despite the earlier dive, GLD did recover part of its losses. As long as it now moves up and does not make a lower low, gold may start to perform.
The Gold ETF Chart (GLD; click to enlarge the chart):

Gold takes a hit but is still strong enough for now. Needs to hold the low from Friday.
The 10 Year Treasury interest rate (TNX, tracked by TLT if Bullish; TBT if Bearish): Bottom Fell Apart On Friday
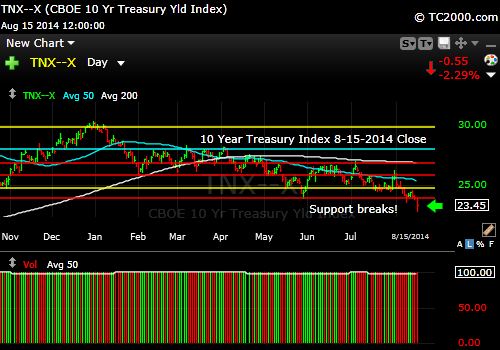
Rates are falling to new lows. The recovery is in doubt!
It concerns me that gold did not rally on this fall in rates. We’ll be prepared to exit as needed.
Before you leave, be sure to check out what individual investors are saying about the markets this week and its likely returns going forward: Survey Says! What Individual Investors Are Feeling
Standard Disclaimer: It’s your money and your decision as to how to invest it.
I thank Worden Brothers for the charting system I use to post these charts. If you want to know more about the charting system I use every day, go to my “Other Resources” page here: Other Resources It makes it much easier to follow along with me if you can see the charts and manipulate them on your own computer. It’s a great investment to have an excellent charting system. Check it out with a free trial at the link above.
Copyright © 2014 By Wall Street Sun and Storm Report, LLC All rights reserved.
