A Market Timing Report based on the 8-22-2014 Close, published Sunday August 24th, 2014
Stocks: We added back other U.S. exposure through individual stocks during the recent bounce and remain fully exposed to the markets.
The SP500 could pull back according to my recent sentiment analysis here:
Survey Says! What About Investor Sentiment?
Right now, we’re at a high above the prior resistance of 1985.59, which was the first high of the four shown below in the daily chart. Now that 1985.59 level is support. A fall below there could bring the pullback that we are looking for. Take a look at the chart and then I’ll go to the Bull case.
For timely updates, please follow me here:
Follow Me on Twitter®. Follow Me on StockTwits®
Here’s the SP500 Index Chart (SPX, SPY; click to enlarge):
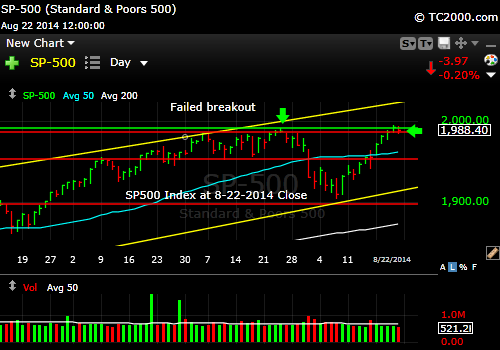
Will the SP500 Index Hold the New High?
The SP500 could remain above the top red line. If so, it has the room to rally further within the upward yellow channel lines shown in the chart above. In fact, it could go well above 2000.
Where are the small caps (RUT, IWM) at this point in the bounce?
Let’s look at the chart first:

Small Caps Stuck at Resistance Line?
Although they are above the 50 day moving average, they are stuck at the aqua resistance line shown above. That means this could be an ominous “double two” wave up. It’s ominous if not overcome, because the 3rd wave down can be sizable according to Fibonacci wave theory. A close above the aqua line would suggest the gains will continue. But be sure it’s not a one day wonder, which sometimes happens in tests of resistance.
Gold:
The Gold ETF Chart (GLD; click to enlarge the chart):
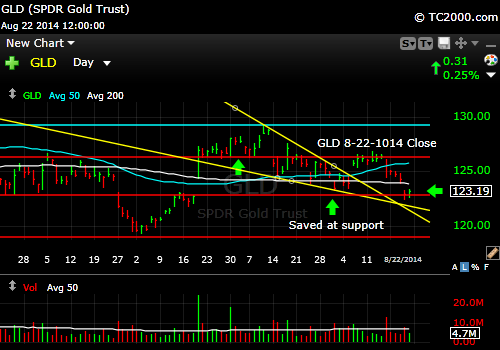
Gold holding a major support line (day 2).
The minute the gold market feels that the Fed is on the war path to contain inflation, it will give up the current support level. But the Fed notoriously falls behind inflation. For now, gold remains a hedge against the Fed falling even further behind the curve. Right now, the Fed IS behind the curve because real interest rates are negative (rates corrected for inflation). If the market believes all is well in the world (esp. with the Russian/Ukraine situation) and that the worldwide economy is improving steadily (not happening at the moment with recessionary fears rising in the Euro-zone), gold could fall. For now, gold is not likely to form a major new low (below the Dec. 2013 low). If you buy here, plan on using a stop loss.
The 10 Year Treasury interest rate (TNX, tracked by TLT if Bullish; TBT if Bearish): Back Above Support, but Barely!
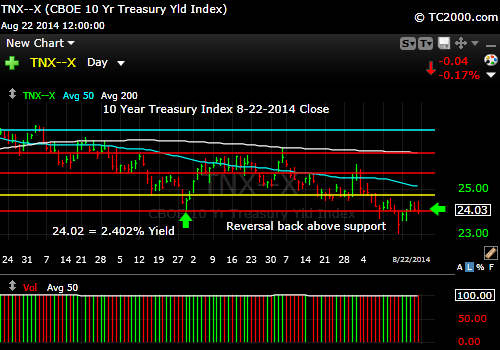
10 Year Treasury Yield Recovers from a Swoon
The picture for the 10 Year Treasury Yield fits together with rates rising and gold on support. My concern now is that rates rise too rapidly (not happening yet by any means) and drive gold through support (see gold ETF chart above). Rates are just 0.001% above the prior major low of 2.402%. That’s not a reversal of note at this point. The best situation for gold would be rates that fall further below the red line shown above.
Standard Disclaimer: It’s your money and your decision as to how to invest it.
I thank Worden Brothers for the charting system I use to post these charts. If you want to know more about the charting system I use every day, go to my “Other Resources” page here: Other Resources It makes it much easier to follow along with me if you can see the charts and manipulate them on your own computer. It’s a great investment to have an excellent charting system. Check it out with a free trial at the link above.
Note that the newsletter is now closed to new subscriptions, but may be re-opened in the future. Stay tuned here in the meantime and follow all the action via the Twitter® and StockTwits® links above.
Copyright © 2014 By Wall Street Sun and Storm Report, LLC All rights reserved.
