A Market Timing Report based on the 9-05-2014 Close, published Sunday September 7th, 2014
As I was nearing work on September 11th, 2001, the first plane struck 1 World Trade Center in Manhattan, just 1 1/2 hours away, instantly killing hundreds of people on impact, soon to lead to nearly 3000 deaths. It is to them we owe a moment of silence this week. Pause if you would and consider them for just one minute and then we’ll continue to the markets….
SP500 Index (SPX, SPY):
We are now 11 days past the first of two breakout attempts on the daily Sp500 chart. The first breakout failed as you see below. Now that we are at a new closing high, there is room above to about 2035 at the channel line if the Bulls want it.

Eleven Days since the Last Breakout
Meanwhile, this week the investor sentiment data fits the 7-10-2013 scenario I outlined here (learn what the downside risk is): Survey Says! What About Investor Sentiment?
U.S. Small Caps: Where are the small caps (RUT, IWM) at this point? The small cap market is slowing down. We could see a dip here. Is there room to run higher? Yes, but as mentioned last week, valuations do NOT support such a movem although that has not always stopped rallies.
Let’s look at the small cap chart:
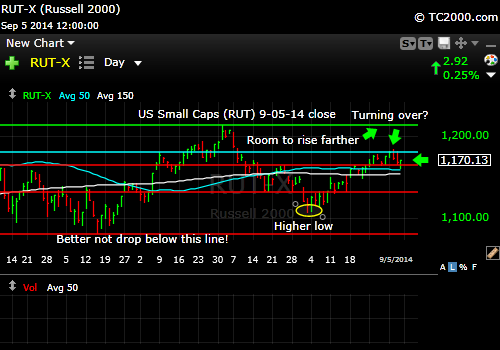
Small Caps turning over for a fall?
For timely updates, including buys and sells, please follow me here: Follow Me on Twitter®. Follow Me on StockTwits® You don’t have to make comments yourself to read my messages.
Gold: GLD, the gold ETF, has fallen through a level of support. The first red line below the current level on the chart below is now our target.
The Gold ETF Chart (GLD; click to enlarge the chart):

Gold is slipping.
The 10 Year Treasury interest rate (TNX, tracked by TLT if Bullish; TBT if Bearish): Rates have made a reversal back above a prior breakdown point. They’ll need to rise a bit more to break the obvious down trend on the daily chart below. If rates collapse back once more and the U.S. dollar fails, the metals will be supported.

Rates are reversing upward from a previous break.
Be sure to visit the website at: Sun and Storm Investing™
Standard Disclaimer: It’s your money and your decision as to how to invest it.
I thank Worden Brothers for the charting system I use to post these charts. If you want to know more about the charting system I use every day, go to my “Other Resources” page here: Other Resources It makes it much easier to follow along with me if you can see the charts and manipulate them on your own computer. It’s a great investment to have an excellent charting system. Check it out with a free trial at the link above.
Note that the newsletter is now closed to new subscriptions, but may be re-opened in the future. Stay tuned here in the meantime and follow all the action via the Twitter® and StockTwits® links above.
Copyright © 2014 By Wall Street Sun and Storm Report, LLC All rights reserved.
