
A Market Timing Report based on the 9-12-2014 Close, published Sunday September 14th, 2014
The SP500 Index is slipping off a test of 2000. The red arrows in the chart below show you a few of the support levels that could be tested in the next move. The big news this week comes on Wednesday with the Fed meeting announcement and press conference, the latter always an extra chance for Dr. Yellen to screw things up by saying too much. Let’s see what she’s not buying in the equity markets this month! Last time it was social media stocks and biotech. Instead of proclaiming bubbles, she should do something to prevent them. The Fed is directly responsible for the big move in the stock markets since the March 2009 low and everyone but the Fed admits that.
What to do? Have some cash, even if it’s just 10% or 20% of your usual allotment to stocks. Then you’ll have something to add back if we get a deeper correction. And if we don’t get it, you can always add that money back and pull it out still higher. If you want to hold through a 4-10% correction or more, that’s fine too. It’s just not my personal plan.
To find out what I’m going, including buys and sells, please follow me here: Follow Me on Twitter®. Follow Me on StockTwits® You don’t have to make comments yourself to read my messages.
SP500 Index (SPX, SPY):

SP500 is failing off a top near 2000. How low do we go?
Meanwhile, this week the investor sentiment data is still unfolding as in the 7-10-2013 scenario I outlined two weeks ago (learn what the downside risk is): Survey Says! What About Investor Sentiment?
U.S. Small Caps: Where are the small caps (RUT, IWM) at this point?
A lower high has been formed as seen on the chart below and due to stretched valuations, we could see more downside soon. Small caps continue to badly trail large caps as I suggest would happen much earlier this year. We currently have no exposure to small cap U.S. stocks in our model portfolio. Markets sometimes take a while to form tops, so we won’t attempt to calculate every potential blip up or down. Simply recognizing that they are a poor bet from a valuation standpoint is enough.
The U.S. Small Cap Chart:
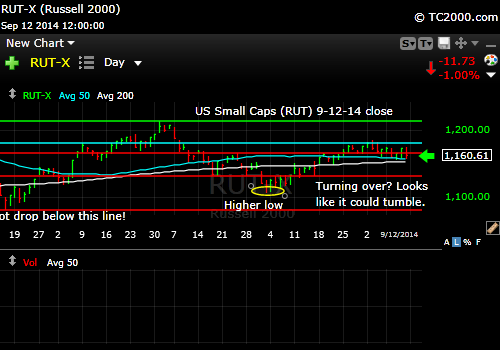
Small caps are in consolidation off a lower high. Still overvalued.
Gold: GLD, the gold ETF, has fallen through yet another level of support. The first red line below the current level on the chart below is now our target, but the next chart reveals what could save gold from reaching that low.
The Gold ETF Chart (GLD; click to enlarge the chart):
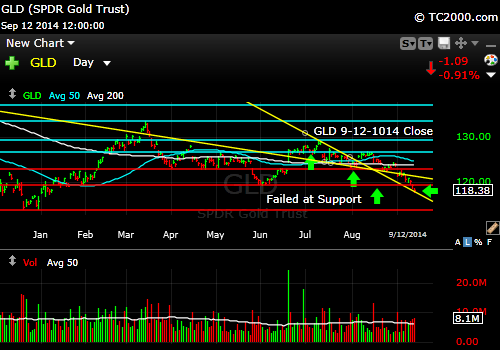
Gold two days under important support headed back to the prior low. What could save it before it hits that bottom red line?
What could save gold is the 10 Year Treasury. Rates shot up a bit too fast last week and that sort of stretch can do one of two things: 1. Snap and keep right on going UP or 2. Snap back and fall hard, thereby bringing the U.S. dollar back down and gold up. I favor the latter as the world’s economy is slowing down significantly with an imminent recession in Euroland (not in the UK yet though; the Scottland independence issue has been weighing there – likely to fail). China is slowing a bit as well, although their market may be favored over ours for some time due to its higher growth, and Japan seems to be in trouble despite their money printing adventures. That’s why we have been raising some cash and favoring rates not getting out of control to the upside here. They WILL eventually have to rise, but now is probably not the time.
What would mess up the above hypothesis? If the Fed keeps pulling the plug on QE and shortening the time to raising rates, we’ll get the “snap UP” in yield scenario outlined above.
The 10 Year Treasury interest rate (TNX, tracked by TLT if Bullish; TBT if Bearish):
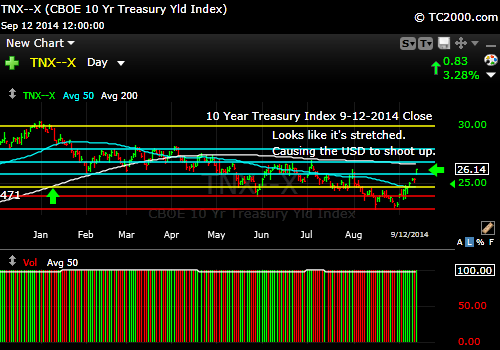
Now we have a reversal above 2.402% last week and kept on going this week. But is that about it?
Be sure to visit the website at: Sun and Storm Investing™
Standard Disclaimer: It’s your money and your decision as to how to invest it.
I thank Worden Brothers for the charting system I use to post these charts. If you want to know more about the charting system I use every day, go to my “Other Resources” page here: Other Resources It makes it much easier to follow along with me if you can see the charts and manipulate them on your own computer. It’s a great investment to have an excellent charting system. Check it out with a free trial at the link above.
Note that the newsletter is now closed to new subscriptions, but may be re-opened in the future. Stay tuned here in the meantime and follow all the action via the Twitter® and StockTwits® links above.
Copyright © 2014 By Wall Street Sun and Storm Report, LLC All rights reserved.
