A Market Timing Report based on the 1-02-2015 Close, published Sunday January 4, 2015
The S&P 500 Index failed a breakout and turned lower. I believe it is just a pullback in a Bull trend. Sentiment got a bit high with the Bull minus Bear spread % rising above 30 again, so the market was due a pullback. For now it is more likely a dip vs. a more significant correction like the one we had in October. You can see how the market has pulled back to the magenta line, which is a line that marks the up trend line connecting the 2001 and August lows. Never bet the farm on any one entry point though.
SP500 Index (SPX, SPY; click the chart to enlarge it):

Reversal.
Last week I said: “This still holds: ‘I suspect that if oil does not maintain the current consolidation (see the charts I posted to Twitter®), and falls, the stock market will pull back a bit.'” Indeed, oil broke to new closing lows and the stock market eased. Oil stocks have yet to break down again definitively however.
To find out what I’m doing, including buys and sells, please follow me here: Follow Me on Twitter®. Follow Me on StockTwits® You don’t have to make comments yourself to read my messages.
What about U.S. small caps? They reversed from new all time highs. The nearest support is provided by the prior lower highs (top red line for example).
The U.S. Small Caps (RUT, IWM): Russell 2000 U.S. Small Cap Chart (click the chart to enlarge it):
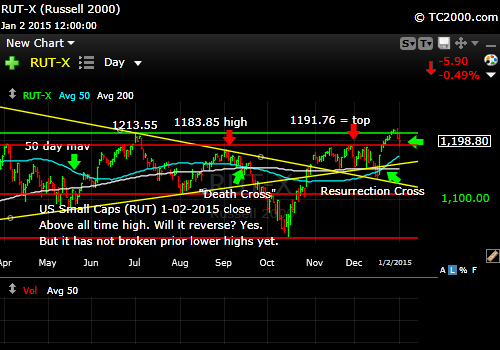
Small cap rally halted at prior high. We are still above the lower highs which offers some support.
Gold is faltering too with decreased volume kicks on up days for the past 4 weeks now. It closed Friday back below the Dec. 2013 low of 114.46, which is negative. Buyers need to come back in soon or Goldman will start looking smart. The issue is that low rates are being interpreted as a sign of DEFLATION rather than a sign of impending INFLATION. Lower rates do help gold on the margin, but not if deflation fears are rampant.
The Gold ETF Chart (GLD; click to enlarge the chart):

Gold volume is not there yet to sustain a rally.
The 10 Year Treasury interest rate (TNX, tracked by TLT if Bullish; TBT if Bearish): The 10 Year yield rose to my 2.3% target and pulled back. The rally DID resume from there as predicted last week (falling yields).
Please Click the TNX Chart to enlarge it:
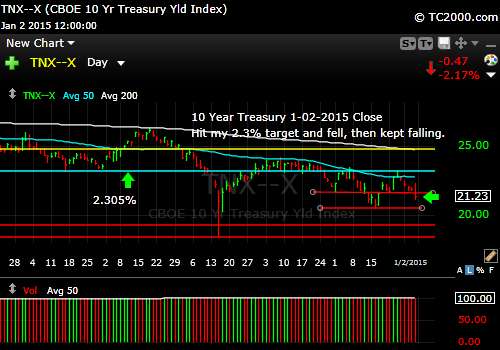
Rates falling again.
Summary: The U.S. stock markets have failed breakouts. The pullback is not likely to be too great as the U.S. economy, although slowing a bit, still shows signs of strength. The employment report on Friday will be important, because if the economy is healthy, jobs should continue to expand strongly. If not, the Federal Reserve is on hold, which the market may ironically appreciate. The issue is that a drop of earnings would raise valuations further and be a drag on further appreciation of stocks. There is not enough volume yet in the gold market. Rates are falling further and that may stimulate a real rally in gold with volume.
I cover foreign markets on social media (see links above) and in my newsletter. Note that the newsletter is now closed again to new subscriptions: Join the Wait List to Join the Newsletter as a Loyal Subscriber, Opening again for the April. 4th issue. If you join and don’t read the newsletter, you will be deleted. I don’t publish to non-readers as other newsletters do. Stay tuned here in the meantime and follow all the action via the Twitter® and StockTwits® links above.
Be sure to visit the website at: Sun and Storm Investing™
Standard Disclaimer: It’s your money and your decision as to how to invest it.
I thank Worden Brothers for the charting system I use to post these charts. If you want to know more about the charting system I use every day, go to my “Other Resources” page here: Other Resources It makes it much easier to follow along with me if you can see the charts and manipulate them on your own computer. It’s a great investment to have an excellent charting system. Check it out with a free trial at the link above.
Copyright © 2015 By Wall Street Sun and Storm Report, LLC All rights reserved.
