
A Market Timing Report based on the 12-26-2014 Close, published Sunday December 28th, 2014
U.S. Markets reached new highs in both large and small cap markets in the U.S. as we may have entered a sweet spot where the Fed stays out of the way due to slowing of growth worldwide, and U.S. growth is still enough to keep the stock market happy with earnings growing slowly. The U.S. economy is stronger than most economies around the world courtesy of aggressive Fed monetary policy resulting in an upward revision in GDP numbers this past week. Here is the statement from the government:
Real gross domestic product -- the value of the production of
goods and services in the United States, adjusted for price
changes -- increased at an annual rate of 5.0 percent in the
third quarter of 2014, according to the "third" estimate
released by the Bureau of Economic Analysis.  In the second
quarter, real GDP increased 4.6 percent.
SP500 Index (SPX, SPY; click the chart to enlarge it): At new highs. The yellow channel line is the next target unless oil tanks again Monday. It was about to break on Friday but didn’t. See Twitter for the recent charts I’ve published for WTI oil.
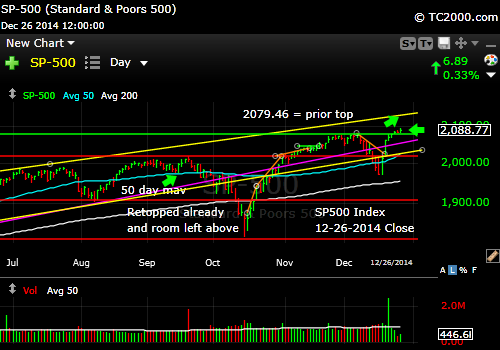
Making new highs on the way to a channel test.
This still holds: “I suspect that if oil does not maintain the current consolidation (see the charts I posted to Twitter®), and falls, the stock market will pull back a bit.” The market responded positively when the Fed said it may or may not raise rates. The 80% odds of a Santa Claus rally indeed came true, but now we’re on to 2015.
This also came true: “Reports on retail sales should be strong through Christmas, because Consumer Sentiment was extremely high in the last report (see Bloomberg data).”
Here is the report card from Mastercard per Reuters: “U.S. retail sales rose 5.5 percent from the day after Thanksgiving through Christmas Eve as solid demand for women’s apparel, jewelry and casual dining offset surprisingly sluggish sales of electronics, MasterCard said in its holiday spending report.”
To find out what I’m doing, including buys and sells, please follow me here: Follow Me on Twitter®. Follow Me on StockTwits® You don’t have to make comments yourself to read my messages.
What about U.S. small caps? They reached a brand new all time high, but follow through is needed. This is positive in one sense and not so great in another, because they are still overvalued as shown here: Wall Street Journal® Stats. The trailing 12 month PE for the Russell 2000 small caps has declined from 87.23 to 61.63, but the latter is still quite high. A Bull could argue that if the market was dumb enough to pay 87 times TTM earnings, it can do it again, so raise your glass of champagne to high valuation if you wish, but I’ll stick with the SP500 and other strong markets worldwide. Don’t be a sucker and believe the forward earnings PE’s are real, as they do not include “adjustments” for one time accounting issues. The TTM numbers cannot be fudged.
The U.S. Small Caps (RUT, IWM): Russell 2000 U.S. Small Cap Chart (click the chart to enlarge it):

New high so it’s on to the prior stratosphere?
Gold is now just above the level it was at by the close of the Fed FOMC statement day on the 17th, but the lack of volume is a problem and GLD is sitting just below the 50 day moving average where it could again fail. If rates rise, the dollar will rally and pressure gold. If rates continue lower (see 2nd chart below), gold should hold up and then rally however. Gold has NOT fallen to the Goldman target of 1000 from earlier this year, although I did hear they revised their view after been proven wrong. Targets are more useful in the short term than the long term in my experience.
The Gold ETF Chart (GLD; click to enlarge the chart):

Gold up but without volume.
The 10 Year Treasury interest rate (TNX, tracked by TLT if Bullish; TBT if Bearish): The 10 Year yield rose to my 2.3% target and pulled back. The rally could resume from here (falling yields). Stay tuned on Twitter®/StockTwits® for my Buys and Sells.
Please Click the TNX Chart to enlarge it:

Summary: The U.S. stock markets have broken to new highs and there is room above to rally farther. I still don’t like small cap valuations, but the market may tolerate higher PE’s. Gold will do OK given all the loose currencies around the world and the Fed’s willingness to play along. Over the short term, if rates fall, gold will rally. I believe the market is skeptical of how low rates can go from here. They can go lower as long as the rest of the world is doing worse than the U.S. and most of it is at this point with 5% U.S. GDP growth.
I cover foreign markets on social media (see links above) and in my newsletter. Note that the newsletter is open to new subscriptions this week only, so if you are interested, please join the wait list for Loyal Subscribers Only: Join the Wait List to Join the Newsletter as a Loyal Subscriber, Opening for the Jan. 4th issue. If you join and don’t read the newsletter, you will be deleted. Sorry, but I don’t publish to non-readers as other newsletters do. Stay tuned here in the meantime and follow all the action via the Twitter® and StockTwits® links above.
Be sure to visit the website at: Sun and Storm Investing™
Standard Disclaimer: It’s your money and your decision as to how to invest it.
I thank Worden Brothers for the charting system I use to post these charts. If you want to know more about the charting system I use every day, go to my “Other Resources” page here: Other Resources It makes it much easier to follow along with me if you can see the charts and manipulate them on your own computer. It’s a great investment to have an excellent charting system. Check it out with a free trial at the link above.
Copyright © 2014 By Wall Street Sun and Storm Report, LLC All rights reserved.
