
A Market Timing Report based on the 1-16-2015 Close, published Monday January 19th, 2015
The S&P 500 Index (SPX, SPY) has bounced from a higher double bottom, but the bounce is just barely above (< 1 pt) a prior resistance level. The close was also below the high of the prior day, which is a sign of weakness in a bounce. The encouraging volatility picture is the formation of a lower double top in the VIX, and there is plenty of room to the downside (which means upside for SPX). The buying point this week was 1992 at the double bottom. Where are we now? Basically in the middle of a range, which is not such a great buying point unless you have no exposure.
SP500 Index (SPX, SPY; click the chart to enlarge it):

Higher double bottom low formed is one step forward, but at resistance.
To find out what I’m doing, including buys and sells, please follow me here: Follow Me on Twitter®. Follow Me on StockTwits® You don’t have to make comments yourself to read my messages.
As for U.S. small caps, they looked much worse in 2014 for most of the year, but the index is still below the 50 day moving average, clearly not the best buying point.
The U.S. Small Caps (RUT, IWM): Russell 2000 U.S. Small Cap Chart (click the chart to enlarge it):

Friday’s gains did not overcome Thursday’s losses.
Gold is at the top of the prior channel on increased volume. The volume is good, but it will need to keep moving up within a day or two and then we could see more serious gains. Otherwise, it’s back down for another retest. I think the concerted destruction of currencies around the globe in the face of deflation is making gold look good in comparison. The strength of the U.S. dollar is the key problem for GLD, but not if gold is being used as a safe haven trade by the rest of the world. Heavy gold buying abroad CAN overwhelm the weakness of gold in U.S. dollar terms due to dollar strength. Buyers may be stepping up their buying in the U.S. too based on the belief that the Fed will have to come back with more easing of policy that will involve a higher risk of inflation.
The risk of owning gold here? If the world economy starts to pick back up, gold will be less in demand.
The Gold ETF Chart (GLD; click to enlarge the chart):

Gold is at the top of the channel.
The 10 Year Treasury interest rate (TNX, tracked by TLT if Bullish; TBT if Bearish): Rates fell to a key support level, but there is clearly still room for a further decline in yields.
Please Click the TNX Chart to enlarge it:
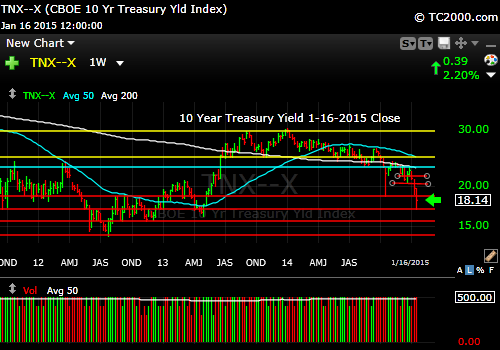
Rates caught one level of support, but there is still room for lower yields.
Finally, a note on China. The Chinese market local “A shares” had a very bad day on Monday, down about 7.7%. The Hong Kong listed stocks likely held up better than funds holding A shares like ASHR, and Chinese stocks are up about 1.85% in Tuesday’s market based on a report of 7.4% growth for 2014, slightly below that of 7.7% for 2013, so we’ll have to see where FXI (Hong Kong listed Chinese shares) lands by morning. I think the fear about less stock buying on margin will pass and the economy will get the stimulus needed from the government, but it’s something we’ll have to monitor closely.
I cover foreign markets on social media (see links above) and in my newsletter. Note that the newsletter is now closed again to new subscriptions: Join the Wait List to Join the Newsletter as a Loyal Subscriber, Opening again for the April. 4th issue. If you join and don’t read the newsletter, you will be deleted. I don’t publish to non-readers as other newsletters do. Stay tuned here in the meantime and follow all the action via the Twitter® and StockTwits® links above.
Be sure to visit the website at: Sun and Storm Investing™
Standard Disclaimer: It’s your money and your decision as to how to invest it.
I thank Worden Brothers for the charting system I use to post these charts. If you want to know more about the charting system I use every day, go to my “Other Resources” page here: Other Resources It makes it much easier to follow along with me if you can see the charts and manipulate them on your own computer. It’s a great investment to have an excellent charting system. Check it out with a free trial at the link above.
Copyright © 2015 By Wall Street Sun and Storm Report, LLC All rights reserved.
