A Market Timing Report based on the 2-20-2015 Close, published Sunday February 22nd, 2015
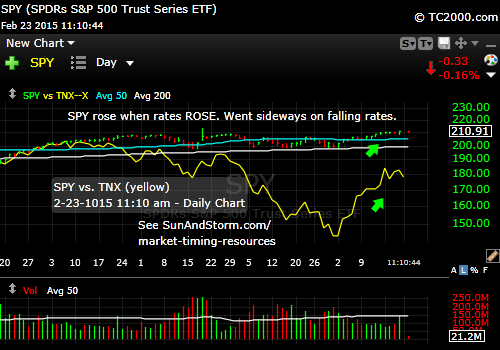
UPDATE 2-23-2015 @ 11 am: What do you follow this week as Dr. Yellen testifies on Tues at 10 am and again in the House at 10 am on Weds?
Follow interest rates. Note the strong positive correlation between rates and the SP500 recently. If what she says drives rates lower, look for stocks to pull back a bit and at least go sideways within a range (dipping toward the lower end of the range at first).
If she implies that the Fed is on auto-pilot and will raise rates despite worldwide deflation, the market will continue higher. That is what this chart indicates:
What will drive stocks down significantly? A recession brought on by the Fed continuing to raise rates despite a slowing world economy.
And now on to this Sunday’s charts:
I’m continuing with the terse comment format this week. Should save both you and me time and get us to the point much faster! The rest is on Twitter®/StockTwits®.
The SPX is again at a new high. Sentiment, as mentioned on Twitter, is stretched, but it’s just one parameter we follow, in this case, a bit of a warning not to be overextended in exposure here. That said, there is plenty of room to the upside in terms of the technicals. There has been a long consolidation preceding the lastest two breakouts. The top yellow channel line is currently at about 2174.
SP500 Index (SPX, SPY; click the chart to enlarge it):
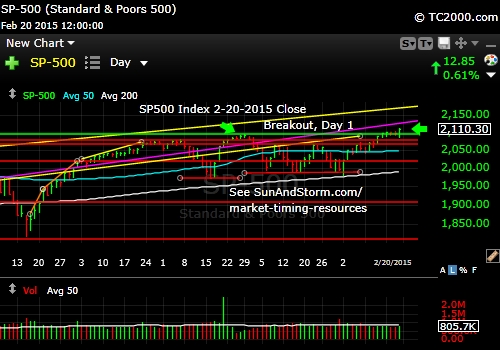
New highs! Are investors tapped out?
To find out what I’m doing, including buys and sells, please follow me here: Follow Me on Twitter®. Follow Me on StockTwits® You don’t have to make comments yourself to read my messages.
Small caps also made a new high. Sound like a re-run of last week? Because it is.
Russell 2000 U.S. Small Cap Chart (RUT, IWM; click the chart to enlarge it):

New highs in small caps too.
Gold took another hit, and some sort of higher low must be found soon. The rally from the prior base could continue provided that rates pull back (see both charts below). Fear has been falling of late, so gold falls and rates rise as U.S. Treasuries are less favored.
The Gold ETF Chart (GLD; click to enlarge the chart):

Gold is falling as rates rise.
Rates went higher on falling fear as Europe seems less tainted by Greece (at least for the 4 months they bought). However, Russia is still causing distress in Eastern Ukraine. Can Russia stand another round of sanctions? There is clearly room on a technical basis for a rise in the 10 Year to the 200 day moving average (white line), this despite the pull in the other direction due to the fact that U.S. rates can fall far before they catch up to Europe and Japan.
Please Click the TNX Chart to enlarge it (see related ETFs, TLT, TBT and UBT):

Rates rise as fear falls.
CONCLUSIONS: We have two BRAND new RE-breakouts in U.S. stocks to talk about this week, the SPX and the RUT. Day 1 over a consolidation is not enough to say it will stick, but it’s an amazing feat, considering the backdrop of declining Q1 Earnings to come. Gold needs to find a higher low fast and that will happen only if interest rates fall again. The Federal Reserve revealed in its minutes this week that they are not going to raise rates too soon, as that would be detrimental to the progress to date. That stance means rates should fall from here or perhaps from the next higher level seen on this week’s chart.
I cover foreign markets on social media (see links above) and in my montly newsletter. Note that the newsletter is now closed again to new subscriptions: Join the Wait List to Join the Newsletter as a Loyal Subscriber, Opening again for the April. 4th issue. If you join and don’t read the newsletter, you will be deleted. I don’t publish to non-readers as other newsletters do. Stay tuned here in the meantime and follow all the action via the Twitter® and StockTwits® links above.
Be sure to visit the website at: Sun and Storm Investing™
Standard Disclaimer: It’s your money and your decision as to how to invest it.
I thank Worden Brothers for the charting system I use to post these charts. If you want to know more about the charting system I use every day, go to my “Other Resources” page here: Other Resources It makes it much easier to follow along with me if you can see the charts and manipulate them on your own computer. It’s a great investment to have an excellent charting system. Check it out with a free trial at the link above.
Copyright © 2015 By Wall Street Sun and Storm Report, LLC All rights reserved.
