A Market Timing Report based on the 5-15-2015 Close, published Sunday May 17th, 2015
I deliver extremely focused comments on the markets. These are supplemented with “Tweets/StockTwits” (see links below).
SP500 Index: Testing just above a prior important top. Frankly, these new highs can fail, but they can also lead to new highs. They are possible turning points. It’s far better to buy lower than to buy once the breakout is happening. We’ve already bought and hedged a bit, and we’ll let the market show us the way.
The chart overall is more positive than negative now, as it is an ascending triangle (higher lows with a flat top). We are now seeing an attempted breakout above the top of the triangle, to which this Bullish formation is supposed to commonly lead. The SPX is actually just below the prior intraday all time high of 2125.92.
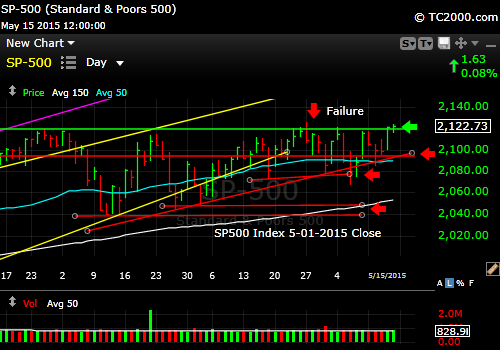
Testing above a prior high. Looking for a new breakout.
US Small Cap Index (RUT, IWM): Has been lagging the small caps due to recent dollar strength, which may be reversing now. But they are overvalued if the economy is in fact slowing, which recent data suggests.
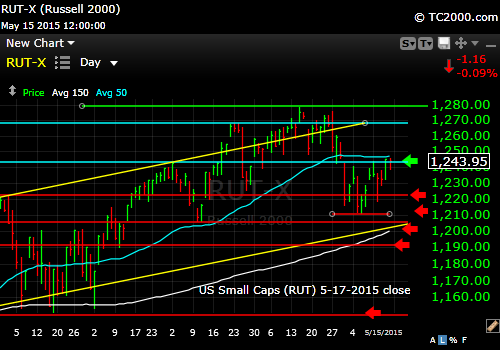
Small caps are lagging large caps. And they’re overvalued.
Gold ETF (GLD): Gold investors will be happier if rates keep falling and lean toward creating negative real rates as discussed. If you have not read my recent article on gold investment, please do and save yourself a fortune in bad gold bets: Gold Investing Secrets
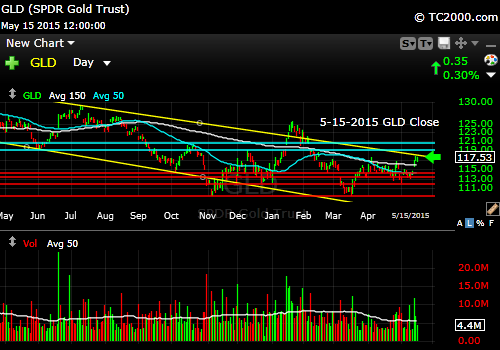
Gold needs to keep moving up. Watch for a stall.
U.S. 10 Year Treasury Note (TNX,TYX, TLT, UBT, TBT).: The last breakout to new highs in yields failed, so the Bulls have the edge here. I added more exposure recently to TLT. A bit early. Lower rates will help gold too. This breakdown in yields came with the softer economic data this week (see my messages on Twitter®Follow Me on Twitter®. Follow Me on StockTwits®).
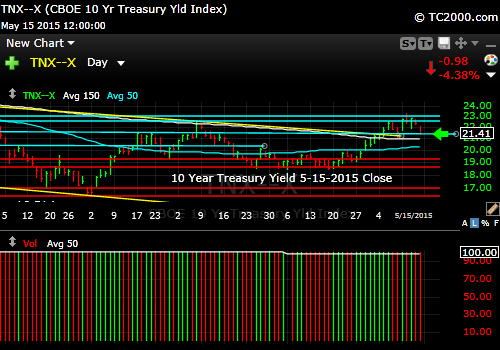
Rates are falling again.
Be sure to visit the website at: Sun and Storm Investing™
Standard Disclaimer: It’s your money and your decision as to how to invest it.
I thank Worden Brothers for the charting system I use to post these charts. If you want to know more about the charting system I use every day, go to my “Other Resources” page here: Other Resources It makes it much easier to follow along with me if you can see the charts and manipulate them on your own computer. It’s a great investment to have an excellent charting system. Check it out with a free trial at the link above.
Copyright © 2015 By Wall Street Sun and Storm Report, LLC All rights reserved.
