A Market Timing Report based on the 5-29-2015 Close, published Sunday May 31st, 2015
I deliver focused comments on the markets. These are supplemented with “Tweets/StockTwits” (see links below).
6-03-2015 MARKET UPDATE: Rates UP-Dollar DOWN-Gold DOWN-Stocks UP says to me market thinks: “Slow recovery continues despite Fed plans to tighten. No inflation issue.”
That interest rates are shooting up makes little sense unless government hiring drives the employment number on Friday to very high levels, but we’ll explore the possibilities below. ADP came in at 201,000 new jobs in the private sector. Only 225,000 total non-farm payroll jobs are expected on Friday when the “employment situation” is reported. That means 24000 government jobs are expected.
Rates go up and keep going up when A) the economic recovery is strong and B) wages are rising and consumption is rising. When there is slow or no growth and buying is weak by consumers, there is no upward pressure on rates. The Fed eases policy or at least does not raise rates in a soft economy.
Consumption has been weak and wage increases have also lagged. The economy registered a negative number for Q1, which many economists are saying “just isn’t true” as you cannot have 200,000 new jobs being created in a month in a recession, which means 2 quarters of GDP negative growth. The truth is probably somewhere in between.
Are rates going up simply because the bond market is panicking? They are supposed to be smarter than that. Normally when the Fed raises rates following a loosening cycle, the yield curve flattens, meaning long rates go DOWN, while Fed rates and other shorter rates go UP, because rising Fed rates slow the economy to keep it from getting too hot, and inflation fears are diminished.
So why is the 30 Year Treasury Bond acting as it is and selling off (long rates rising)? Either market participants expect inflation to rear its head, even while it’s now under control OR there is something else at work.
This is a DOLLAR DOWN, RATES UP combination. Why? There are several reasons: 1. Some countries are dumping U.S. dollars. Why? Some speculate this is happening ahead of a decision to allow China to take on a reserve currency role. 2. Europe is getting stronger economically, despite the ECB’s QE program. That can cause the Euro to counter-rally for a period at least until the ECB does it’s next fit of bond buying. It’s not coming from Japan, that is for sure! The yen is at lows, not counter-rallying. 3. If U.S. citizens and non-U.S. non-Euro carrying citizens buy European stocks unhedged, they are buying Euros and selling dollars to do so. If foreigners see the same greater opportunties in Europe, China and Japan, then money leaves the dollar and moves into these other currencies driving down the dollar.
In contrast to Europe, the U.S. economy is slowing somewhat at least in part due to the oil price collapse and its effect on that previously high growth industry. That pressures the dollar. If you own dollars and then sell Treasuries to get rid of dollars, rates rise. Selling then begets more selling as it snowballs.
So what happens now? If the Fed raises rates “one and done” in Sept. or Dec., we could see the resumption of our stock market rally as we work through temporary ups and downs. If they raise rates too fast, they could either slow the economy, bringing down the stock market or tank the stock market with a recession. I believe they’ll error on the side of doing too little vs. the inflation risk rather than getting far ahead of the curve.
Rates have risen ahead of any Fed action so they should fall again IF it becomes clear the Fed is barely going to raise rates.
In the above scenario: 1. Stocks make further gains and will be up 6 months from these levels. 2. Rates should stay relatively low for at least 6 months as well. 3. Eventually the Fed will be behind inflation with a slowly growing economy at best, and gold will rally. Gold could have a floor in if this scenario is valid. But, and it’s a big but, IF the economy becomes extremely strong, gold will sell off as higher returns are chased and the U.S. dollar strengthens.
What do we really want as a nation in the U.S.? As all nations do, we want a strong economy with rising productivity and with that will generally come wage and spending growth. Those entail a stronger U.S. dollar and relatively low interest rates if inflation is under control.
And now for this past Sunday’s review of the markets…
SP500 and Russell 2000 Small Cap Indices: Both are coming off tops and may correct some more. Now that rates are falling once again (see TNX chart below), the dollar may weaken from here again and that would mean the advantage small caps had vs. large would disappear.
For the SP500, there are two failed breakouts now off the Feb. high. On the other hand AAII Investor sentiment implies that within 6 months the market will likely be higher. So when the market eases back, we’ll most likely be buying, not selling. The thing that would interfere with this scenario? A recession. GDP was revised to negative for Q1, but is not expected to be negative for Q2, but if it is, that would be the beginning of a recession by standard definitions.

Coming down?
Russell 2000 U.S. Small Cap Index (RUT, IWM): A lower high has formed on the daily chart shown below.

Small caps form lower high.
Gold ETF (GLD): Gold may be aided by falling interest rates, but not if inflation falls faster. (see prior article on buying gold). It is NOT a good sign that gold is not rallying with falling rates this week. We have no trading position currently, only a long term hold as currency insurance. That 112ish level (2nd red line from bottom) needs to hold in this pullback.
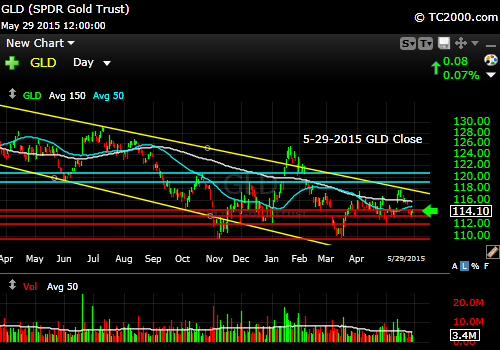
Gold is stuck in a range.
U.S. 10 Year Treasury Note (TNX,TYX, TLT, UBT, TBT): This breakdown in yields came with the softer economic data (see my messages on Twitter®Follow Me on Twitter®. Follow Me on StockTwits®).

Rates are falling.
CONCLUSIONS:
1. The U.S. stock markets are in correction. If the recovery muddles on, it will be a buying opportunity.
2. Gold is not progressing. It is gyrating within a range.
3. Rates are falling again.
Be sure to visit the website at: Sun and Storm Investing™
Standard Disclaimer: It’s your money and your decision as to how to invest it.
I thank Worden Brothers for the charting system I use to post these charts. If you want to know more about the charting system I use every day, go to my “Other Resources” page here: Other Resources It makes it much easier to follow along with me if you can see the charts and manipulate them on your own computer. It’s a great investment to have an excellent charting system. Check it out with a free trial at the link above.
Copyright © 2015 By Wall Street Sun and Storm Report, LLC All rights reserved.

You are welcome Charles! Your taking a more aggressive stance than I am, but the way you are using my insights is obviously working for you. I’ll deploy more cash lower as well. If I believed we were headed into recession, I’d be bringing my exposure below 100% of maximum usual worldwide exposure (now at about 102% vs max usual). That said, I am hedged to the tune of about 24%, meaning I’ve sold options against various positions including AAPL and SPY/SSO, and even sold options around two brand new positions yesterday, which gives me some downside protection, although it also potentially blunts my upside. I do this when I expect a further correction or feel it is a reasonable probability. The expected gains when these options were locked in were very reasonable annualized returns, so it was worth doing (roughly 14%-26% simple annualized gains).
I moved to a 50% cash position on Monday June 1st. I will be looking for entry points to buy. As in the past and again, your work is invaluable!