A Market Timing Report based on the 9-18-2015 Close, published Saturday September 19th, 2015
I deliver focused comments on the markets. These are supplemented with “Tweets/StockTwits” (see links below).
UPDATE 9-25-2015: Note that if today is an UP day, which is the way it is starting, we’ll have a higher low, which sets up a further rally. We need a close above 1950 to turn the downtrend to an uptrend on a short term basis.

A Chance for More Strength.
UPDATE 9-24-2015: A green shoot arises. Read my comments on Twitter/StockTwits as they are more comprehensive (click the chart to enlarge it a bit):
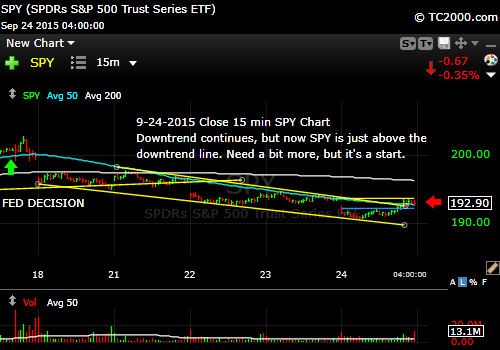
A green shoot…the start of a real rally finally following the Fed decision to not raise rates?
UPDATE 9-21-2015: The Bullish Case: The Bulls regain the ball with a close above 1993.48 that sticks…unlike the last false breakout ahead of the Fed. Short of that, we remain in a trading range that has the potential to break to the downside if earnings are worse than expected. Earnings season starts October 8th with Alcoa (AA).
1. SP500 Index: So after the long, long wait for the Federal Reserve’s decision, they decided to do nothing! Nothing (no rate hike) was what the market supposedly wanted, but after the decision, it was “sell the news” or “sell the uncertainty of months of not knowing when the rate hike hammer will fall.” Behind that uncertainty is a weakening world economy. If the upcoming earnings season underwhelms the markets, that alone could result in a test of either the prior low of 1867 or 1821. Having some cash will allow us to take advantage of those retests of lows.
After the Fed’s inaction, the SP500 Index fell from the high of the recent trading range, the low of which was reached after a 3 day crash beginning on 8-20. Yes, a crash. The computers failed AGAIN. We thought they repaired things after the May 2010 Flash Crash, but they did not. Some ETF’s such as SYLD fell from a 30.06 close the prior day to 15.26 for a momentary fall of 49%. Some lucky buyer got a big discount during the Flash Crash of August 24th, 2015. Have a look…
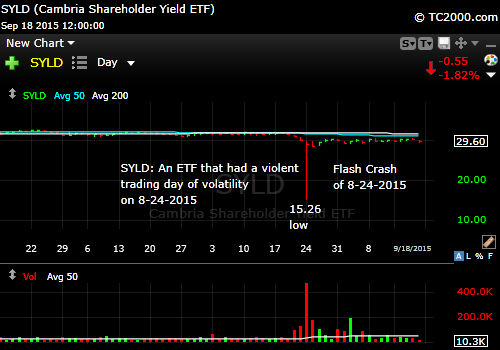
Flash Crash “Victim”
A novice looking at the current SP500 chart below would conclude that we should hit the Flash Crash 2 low within a few days. It’s hard to see what positive events would intervene to allow the SPX to stop at that first red support line, though it could. I’d save some cash for the 1821 level that everyone seems to be waiting for. Obvious numbers oddly enough are often reached by markets that are confused and are figuring out where to go.
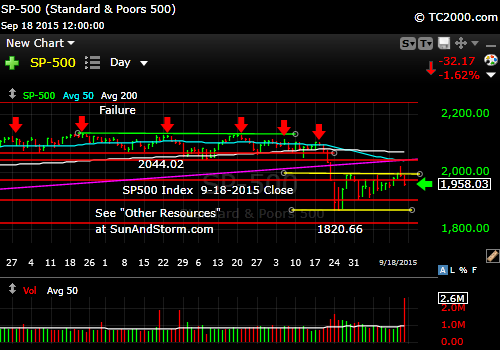
Ready to retest?
Keep up to date at Twitter and StockTwits (links below).
(See my messages on Twitter® Follow Me on Twitter®. Follow Me on StockTwits®).
2. Small caps should retest the lows as well.
Russell 2000 U.S. Small Cap Index (RUT, IWM; click to enlarge):

3. I said last week, “Gold is attempting to hold a higher low.” It did. The problem with “investing” in gold other than as insurance against currency printing by the Fed, is that it may stay range bound as long as the Fed continues to threaten to raise rates in the near future. If you intend to trade it, be sure to buy low and sell high, and don’t give up your gains, because they may be fleeting.
Gold ETF (GLD):

Gold gains from the Fed inaction.
4. Treasury yields
U.S. 10 Year Treasury Note (TNX,TYX,TLT,TBF): The 10 year Treasury yield appears to hit a temporary high which amounted to a false breakout and is falling again. There should be more follow through to the downside, which is good for Treasury investors (TLT), but there will be a range established based on the continued threat of the Fed to raise rates as mentioned above for gold. Buy rate fear and sell the greed of the Treasury highs.

Rates fall on Fed inaction.
Be sure to visit the website at: Sun and Storm Investing™
Standard Disclaimer: It’s your money and your decision as to how to invest it.
Note that the newsletter is now CLOSED to new subscriptions: Join the Wait List to Join the Newsletter as a Loyal Subscriber, Opening again for the October 4th issue. If you join and don’t read the newsletter, you will be deleted. Why? I don’t publish to non-readers as other newsletters do. I surround myself with committed people who value what we are doing. Stay tuned here in the meantime and follow all the action via the Twitter® and StockTwits® links above.
I thank Worden Brothers for the charting system I use to post these charts. If you want to know more about the charting system I use every day, go to my “Other Resources” page here: Other Resources It makes it much easier to follow along with me if you can see the charts and manipulate them on your own computer. It’s a great investment to have an excellent charting system. Check it out with a free trial at the link above.
Copyright © 2015 By Wall Street Sun and Storm Report, LLC All rights reserved.
