
A Market Timing Report based on the 10-23-2015 Close, published Sunday Oct. 25th, 2015
UPDATE 10-27-2015: Gold On Pause for…? (click chart to magnify)
See the five day pause near the green arrow at the right? Gold is waiting for the Fed as GLD could have easily broken down having failed to hold the breakout above 112.12. In my opinion, gold’s next move is likely UP unless the Fed raises rates prematurely at the meeting this week. That would send gold down sharply. I consider a Fed hike possible, but unlikely, due to the slowing we’ve seen in U.S. earnings and revenues as reported thus far during the current earnings season – both are negative. I believe the Fed wants this Christmas season to be a recovery period for U.S. GDP and a rate hike would prevent that from happening.
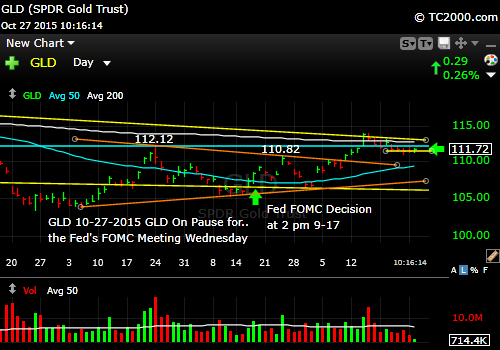
Gold is on pause just below a resistance level for the Fed announcement.
I deliver focused comments on the markets. These are supplemented with “Tweets/StockTwits” (see links below).
1. SP500 Index: Our 2011 Scenario continues to unfold, and as I said on Monday, the market has been “healed” volatility-wise. In other words, things got very dicey quickly and that tension has now dissipated faster than they could say “Cover my shorts!” The Bears have been absolutely wiped out. It doesn’t mean they cannot reappear, but wrong is wrong.
You can now set stops fairly close to the all time highs, which may be a wise decision. If you sell and you are wrong, be willing to get back in. Make your stops mental; never put stops in the market and make it easy for market makers and wild computers to make a fool out of you. I raised a bit more cash during the rally to keep my exposure down to 90% of my usual maximum equity exposure worldwide with about 60% of that is in the U.S. That gives me plenty of upside and some room to invest more aggressively on another pullback.
If you have had a tendency to SELL LOW and BUY HIGH, stop it already! Decide to act differently and start buying as we just did near the lows. It pays.
That said, the easy part of the rally is now over, so buying now should only be done on a slower averaging in basis, as we may see the market sell off once again to a higher low as it did in 2011. I think the market also loved the performance of Secretary Clinton this week, who made the House Benghazi Committee Chair Gowdy look silly along with his colleague Congressman Jim Jordan who kept asking the same questions of her over and over. Even if you don’t like Hillary, her opposition looked partisan, and the public realized that. The country is tired of the blame game on BOTH sides. As a true independent, I’d ask whether it’s better for us to get on with the business of the country than be bogged down in partisan bickering?
The stock market (with some exceptions, noted) loves the idea of a re-Clinton or a Trump or even a Carson. Hillary’s performance served to dispel worries that she would be bogged down in the muck, and she picked up points immediately from self-proclaimed Socialist Congressman Sanders. Wall Street celebrated.
That does not mean that biotech and drugs are off Hillary’s hook, as I pointed out on social media. They have not participated in the rally. I would stay clear of those names or certainly not overweight them. Valuation based on lower pricing of their products will continue to be the worry. What is a drug company worth if you halve the price of each expensive drug they sell? That’s why companies like Gilead sell for such low multiples. It’s not over either…
Notwithstanding focal blow ups, the big caps did very well this week. Next stop is 2128-2134.28, the all time high. All time is a long time. So I hear. 😉
SP500 Index (SPX SPY; click to enlarge):

Big Caps Rule
So what are the BIG BUTS?
Keep up to date at Twitter and StockTwits: See my messages on Twitter® Follow Me on Twitter®. Follow Me on StockTwits®).
2. What shows up in our charts this week is that neither the mid caps nor the small caps have bounced as well as the large cap stocks, some of which were up over 10% in one day such as MSFT. They are harder for large funds to get out of quickly, but what happened in 2011? The small and mid caps moved right back up with the large caps. If they don’t catch up this time, it is a bad prognostic sign for the large caps holding their gains. Note that both the RUT and MID have failed to recover above their 9-17-2015 highs and 200 day moving averages as the large caps have.
Russell 2000 U.S. Small Cap Index (RUT, IWM; click to enlarge):

Small caps lag large caps.
Here is the lag in the Mid-Cap Recovery (MID, IJH)?
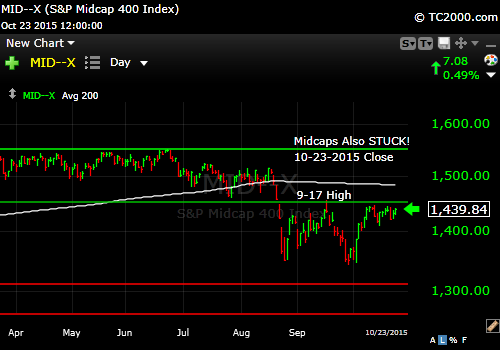
U.S. Mid Caps lag large along with Small Caps.
3. Gold: I believe U.S. rates can come down more as we found out that the ECB is going to ease more in December (and if they don’t, all heck will break loose in Euroland) and the Chinese also eased this week (see FXI chart below). If rates come down in the U.S., the dollar will weaken and gold will RISE in U.S. dollar terms.
The crosswind in favor of gold in all currencies is organic gold buying by nervous Europeans, Japanese, and Chinese who mistrust their countries moves to devalue their currencies. I believe gold can hold to the recent range it’s been in, but again, preserve trading profits as they can be elusive. The positive technically is that GLD is sitting on a weak support line (it’s a bit of an odd trend line as I’m excluding two points just below the middle of the line), but it must hold and I don’t like the way gold closed on Friday.
Gold ETF (GLD):
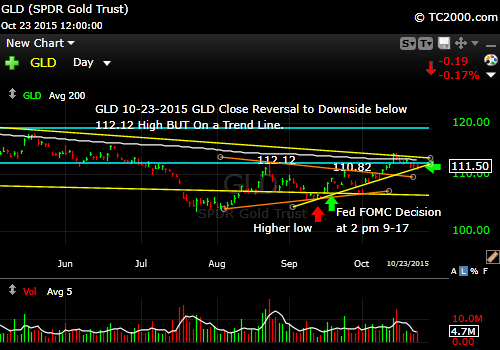
Gold struggles as rates rise a bit, but sits near an up trend line.
4. 10 Year Treasury Note Yield: If U.S. GDP slows further, rates cannot stay as high as they are. I believe that part of the rise in rates this week was a “risk off” phenomenon that has little to do with the intermediate term direction of U.S. interest rates.
U.S. 10 Year Treasury Note Yield (TNX,TYX,TLT,TBF):

Rates rise, but the economy of the world is slowing despite monetary policy.
What’s the Bull thesis? Easy monetary policy worldwide forces investors into stocks, even in China where all the worry has been about sub-7% growth, but look at the rally in Chinese stocks! We’ll look to buy the pullbacks, and cut our losses if we are wrong.
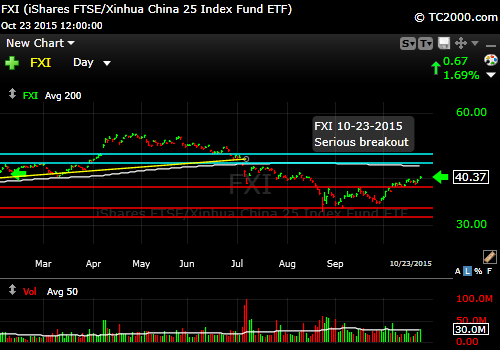
Chinese stocks outdo the naysayers.
What could cause a relapse of volatility? A Fed rate hike! The Fed meets this week with the meeting ending on Wednesday without a news conference. If the market has the sense that the Fed will raise in December or if they surprise the market by raising Fed rates this week, the stock markets will sell off as will the bond/Treasury markets.
I believe October would be too soon for a Fed move, because it does not want a dollar headwind going into Q4, but don’t put a December rate hike past the Federal Reserve who now has a very nicely healed stock market as a backdrop and jobless claims just off a 42 year low. What it lacks is robust worldwide growth. In the end, the Fed may attempt a “face saving rate hike” and live to regret it when it has to reverse it.
My view is that they should be patient (now that they’ve made all the previous bad decisions to steal from savers and reward companies for buying their own stock back with cheap money rather than innovate) and see what the next quarter brings and not ruin the Christmas buying season with another fit of market volatility.
Be sure to visit the website at: Sun and Storm Investing™
Standard Disclaimer: It’s your money and your decision as to how to invest it.
I thank Worden Brothers for the charting system I use to post these charts. If you want to know more about the charting system I use every day, go to my “Other Resources” page here: Other Resources It makes it much easier to follow along with me if you can see the charts and manipulate them on your own computer. It’s a great investment to have an excellent charting system. Check it out with a free trial at the link above.
Note that the newsletter is now CLOSED to new subscriptions: Join the Wait List to Join the Newsletter as a Loyal Subscriber, Opening again for the January 3rd issue. If you join and don’t read the newsletter, you will be deleted. Why? I don’t publish to non-readers as other newsletters do. I surround myself with committed people who value what we are doing. Stay tuned here in the meantime and follow all the action via the Twitter® and StockTwits® links above.
Copyright © 2015 By Wall Street Sun and Storm Report, LLC All rights reserved.

Another successful by low sell high. Protecting these nice gains! I may by small as the market move toward all time highs and I’ll keep my exposure low.