A Market Timing Report based on the 1-22-2016 Close, published Sunday January 24th, 2016
I deliver focused comments on the markets. These are supplemented with “Tweets/StockTwits” (see links below).
UPDATE 2-8-2016: We could go back to “broken” again from “UN-broken today with a close of the Russell 3000 (see chart below) below 1079.87 (Oct. 2014 low). If that happens, it must quickly reverse OR ELSE watch out below. That said, be careful of making big moves in the market, but instead consider taking smaller steps OUT of or INTO the market.
UPDATE 1-29-2016: The market was said to have broken down based on a break of the Russell 3000 Index, an index composed of the top 3000 companies in the U.S. by capitalization. Not any more, which gives the Bulls a big edge having reversed not one but TWO levels where it had previously broken down. I call this market “UN-broken.” Check Twitter/StockTwits links below for more.
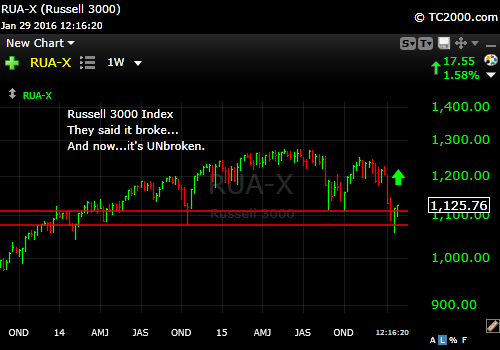
Russell 3000 has reversed TWO breaks.
1. SP500 Index: I said “We’ll be back at the Sept. 2015 low if not the Oct. 2014 low fairly soon.” We did in fact reach the October 2014 (yes, 2014) low as suggested and the index has bounced nicely…so far. I will be publishing a special edition “Brief” tomorrow on why this could just be the first of several shocks to the market. Check back HERE (by Mon night) (will be there by Monday night at the latest).
We now have a tradable rally underway, and we did in fact buy both near the low and a bit higher. This rally may reach all the way back to 1993 for the SP500 Index. I’ll be watching all the rest of the indices to get a sense for when the rally is stalling. Keep up with my comments at either of the two links just below here. I don’t believe the selling is over yet, except for this bounce. The VIX volatility index did fall quickly below 26.81, but all it needs to do is put in another higher low to keep the pressure on the Bulls.
Keep up to date at Twitter and StockTwits: See my messages on Twitter® Follow Me on Twitter®. Follow Me on StockTwits®).
SP500 Index Chart (click chart to enlarge; SPX, SPY):
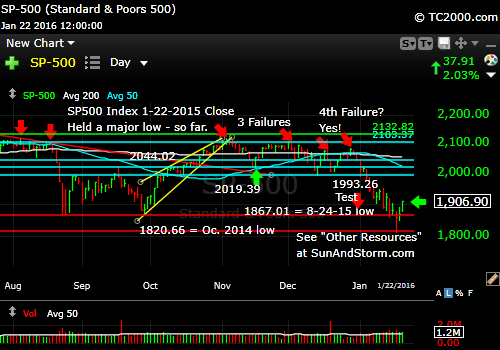
A bounce has started.
2. U.S. Small caps have entered a Bear market even according to my more stringent criteria. They will now likely bounce all the way to 1040ish if not higher (see chart below), but until they reverse the damage done by reversing UP through 1040, the Bear is still on. A quick test back above 1040 and a second failure does not count, so that would be a good place to exit should that level fail again. But let’s see where the market takes us and not get too far ahead of it! The test is only 20 points higher.
Russell 2000 U.S. Small Cap Index (click chart to enlarge; RUT, IWM):

Small caps are ALREADY in a Bear Market and must reverse the damage to rally in any major way.
3. Gold is STILL barely above the prior breakout. I said last week: “If stocks recover from here, which is not a given, gold may go sideways to down.” If the dollar heads back down because a more dovish Fed is anticipated, the gold rally can continue, BUT if the impression becomes that the U.S. economy is still recovering (not in the data yet), gold will fail again and even fall to brand new recent lows. I’ll be following the dollar and interest rates which are intertwined to get a feel for gold’s likely strength. Technically, GLD must rise above that lower yellow trend line on the chart to impress me. My sense is that gold will in fact rally further based on a more dovish Fed. If the Fed goes back to their “deflation is transitory” idiocy, gold will suffer.
Gold ETF (click chart to enlarge; GLD):
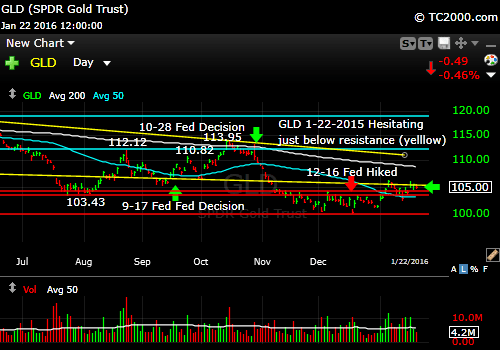
Gold is still facing resistance and needs a further dollar sell off to do well.
4. U.S. 10 Year Treasury Note Yield (click chart to enlarge; TNX,TYX,TLT,TBF): I sold more TLT last week and rates in fact did bounce a bit (bond go DOWN when rates go UP). I believe the 10 Year (TNX) will remain range bound (1.9% to 2.5%) unless we descend into a deeper economic slowdown (recession). Trade the range!
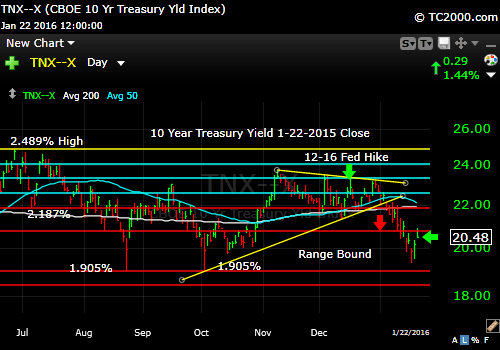
Rates remain bound in a range. Could fall if the Fed becomes more dovish vs. their current hawkish position on rates.
Stay with me through the week via the links to Twitter/StockTwits above.
Be sure to visit the website at: Sun and Storm Investing™
Standard Disclaimer: It’s your money and your decision as to how to invest it.
I thank Worden Brothers for the charting system I use to post these charts. If you want to know more about the charting system I use every day, go to my “Other Resources” page here: Other Resources It makes it much easier to follow along with me if you can see the charts and manipulate them on your own computer. It’s a great investment to have an excellent charting system. Check it out with a free trial at the link above.
Note that the newsletter is now CLOSED to new subscriptions: Join the Wait List to Join the Newsletter as a Loyal Subscriber, Opening again for the April 3rd issue. If you join and don’t read the newsletter, you will be deleted. Why? I don’t publish to non-readers as other newsletters do. I surround myself with committed people who value what we are doing. Stay tuned here in the meantime and follow all the action via the Twitter® and StockTwits® links above.
Copyright © 2016 By Wall Street Sun and Storm Report, LLC All rights reserved.
