A Market Timing Report based on the 6-03-2016 Close, published Sunday June 4th, 2016
I deliver focused comments on the markets. These are supplemented with “Tweets/StockTwits” (see links below).
1. SP500 Index: The employment numbers were not good this week. Only 38,000 new jobs were created in the prior month. That’s not an expansion vs. population growth, and it could turn into a contraction, or…
The “Or” is what I’ve been referring to as the “Muddle Through Scenario.” If the economy continues churning out 0.5% to 1.0% growth for a couple of quarters, the market would probably be OK with it, although individual companies would be at risk. Weak performers will be clocked come next earnings season.
Mediocre growth may actually be preferred by this market, because faster growth will trigger interest rate hikes.
I should add quickly that a rate hike is not an issue IF the economy is in fact strong. That is the natural progression of things. Rates go up when the economy is strong and stocks go up not down at the same time.
The issue now is that the Federal Reserve has made the market overly dependent on loose money and tightening could lead to a contraction, sending the economy into a full recession (two quarters or more of negative GDP). Buybacks have enabled companies to inflate earnings per share by reducing the share number with cheap loans courtesy of the Fed. All of that benefit unwinds at higher rates.
We will continue to stay long with a reduced overall exposure level (see Twitter/StockTwits to see what that is this past week; links below) as long as current conditions do not deteriorate further.
SP500 Large Cap Index (click chart to enlarge; SPX, SPY):
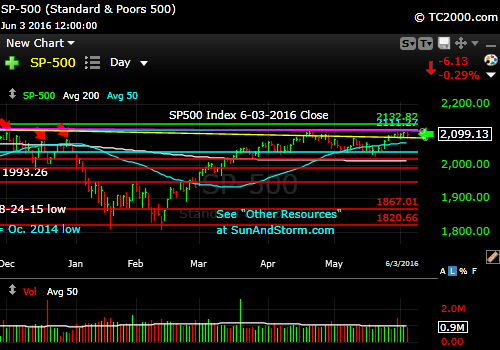
Initial reaction to failing employment growth was muted.
Survey Says! Sentiment this week among individual investors (AAII.com) showed a Bull minus Bear percentage spread at JUST +1.1% this past Wednesday (Bulls 30.17% and Bears 29.05% with Neutrals a Bullish 40.78%; Neutral Scores > 40 are Bullish for markets rising 6 months out.).
Note that although we are near prior market highs for the SP500 Index, sentiment is NOT very Bullish at all. This itself is Bullish! Another reason to stay long as the doubters are converted along the way to higher asset prices. When I see sentiment maxed out at a peak in the market, I consider taking some profits off the table.
Please keep up to date at Twitter and StockTwits: See my messages on Twitter® Follow Me on Twitter®. Follow Me on StockTwits®).
2. U.S. Small caps are STILL above the 1040.47 level that for me defines a Bear market transition point. Small caps are NOT in a Bear market in my view. They are at worst trading in a very large range.
There are multiple higher lows in place, so the Bullish view would be that there was an important reversal back above 1040ish and we have a new up trend above the yellow down trend line shown on the chart below.
The Bear view would be that the 12-2015 high needs to be exceeded and then the prior all time high may not be exceeded.
Russell 2000 U.S. Small Cap Index (click chart to enlarge; RUT, IWM):
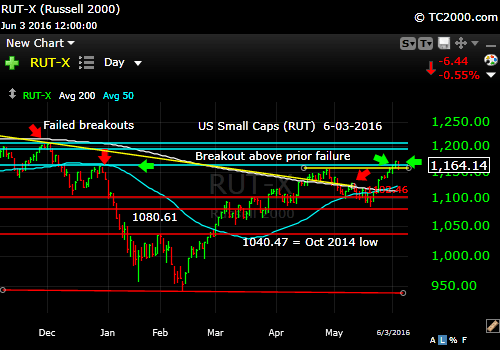
The recovery in small caps is not over yet.
3. Gold: I said “The red line is a line in the sand for gold Bulls.” That was the place to buy if you were Bullish. Or to sell put options on the gold miners as I did recently, closer to the lows. The weaker the economy is, the better it is for gold, because the Federal Reserve will be leaning dovish, attempting to weaken the U.S. dollar (See 2nd chart down). In a Bull market, BUY PULLBACKS, not the rips, in general. The big gold rally on Friday came with increasing volume, which is BULLISH.
Gold ETF (click chart to enlarge the chart; GLD):
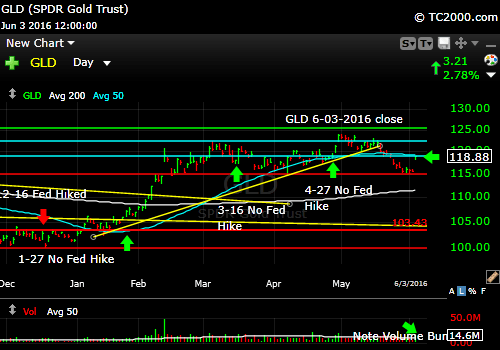
There was a rush back into gold predictably off the previous lows.
Gold’s gain is the U.S. Dollar Pain (UUP, USDX, EUR/USD): The U.S. dollar has resumed its down trend.
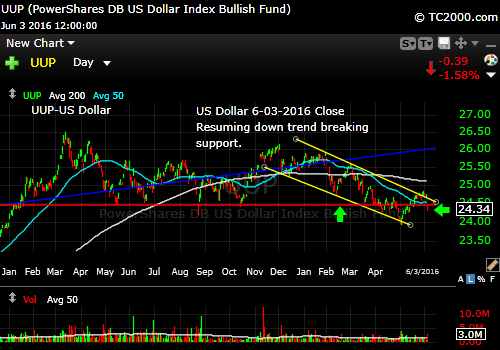
Gold’s gain is the dollar’s pain.
4. U.S. 10 Year Treasury Note Yield (TNX): Rates broke the triangle I pointed out last week to the downside, meaning treasuries rallied. I believe they will persist at low levels until the current economic weakness passes.
U.S. 10 Year Treasury Note Yield (click chart to enlarge; TNX,TYX,TLT,TBF):
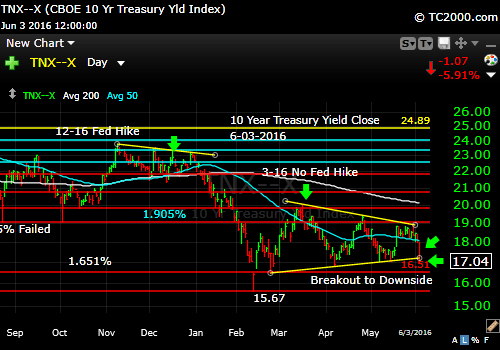
Yields fell dramatically on the economic weakness revealed by the employment numbers this week.
Stay with me throughout the week for the LATEST via the links to Twitter/StockTwits above. Feel free to comment, retweet etc. to spread the word.
Be sure to visit the website for more general investing knowledge at:
Standard Disclaimer: It’s your money and your decision as to how to invest it.
I thank Worden Brothers for the charting system I use to post these charts. If you want to know more about the charting system I use every day, go to my “Other Resources” page here: Other Resources It makes it much easier to follow along with me if you can see the charts and manipulate them on your own computer. It’s a great investment to have an excellent charting system. Check it out with a free trial at the link above.
Note that the newsletter is now CLOSED to new subscriptions: Join the Wait List to Join the Newsletter as a Loyal Subscriber, Opening again for the July 3rd issue. If you join and don’t read the newsletter, you will be deleted. Why? I don’t publish to non-readers as other newsletters do. I surround myself with committed people who value what we are doing. Stay tuned here in the meantime and follow all the action via the Twitter® and StockTwits® links above.
Copyright © 2016 By Wall Street Sun and Storm Report, LLC All rights reserved.
