A Market Timing Report based on the 7-01-2016 Close, published Sunday July 3rd, 2016
I deliver focused comments on the markets. These are supplemented with “Tweets/StockTwits” (see links below).
1. SP500 Index: When you have a bounce as rapid as the one we saw post-Brexit, there is a risk of a pullback. It may only be a shallow one; however, be careful of individual stock risk going into earnings season. Stocks that don’t meet expectations of either earnings and/or guidance will be more severely punished than usual.
SP500 Large Cap Index (click chart to enlarge; SPX, SPY):
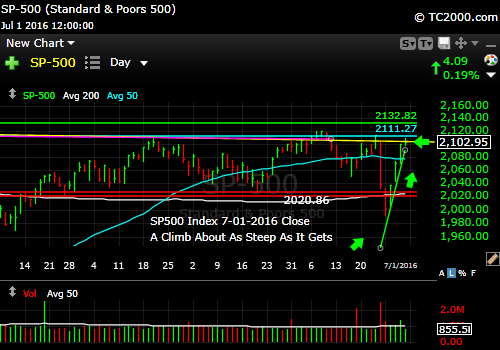
Rapid bounce means we could see a pullback or a pause at best.
Survey Says! Sentiment this week among individual investors (AAII.com) showed a Bull minus Bear percentage spread at minus 4.51% this past Wednesday (Bulls 28.91% and Bears 33.42% with Neutrals at 37.67% [over 40% Neutrals is Bullish for market timing 6 months out]). Sentiment is not particularly helpful at these levels, as there is plenty of room for it to be pushed in either direction by the news flow; however, it certainly does not reflect the sentiment we would see at a top. Investors should be cheering stocks near prior highs. There is hesitation in the negative spread. Investors are expecting a pullback.
Please keep up to date at Twitter and StockTwits: See my messages on Twitter® Follow Me on Twitter®. Follow Me on StockTwits®).
2. U.S. Small Caps: Caution is advised going into earnings as small caps are more volatile than large caps. The name for that risk is “beta.” Beta works for you when stocks are rising and against you when stocks fall.
We bought some mid-caps recently, because their beta is lower than small caps and their earnings have been better. The top of this bounce is not a good time to add to such a position. Why go mid vs. small? You can see on my Twitter home page (above link) that the mid caps have nearly matched the performance of small cap stocks during the recent rise from the February low.
Russell 2000 U.S. Small Cap Index (click chart to enlarge; RUT, IWM):
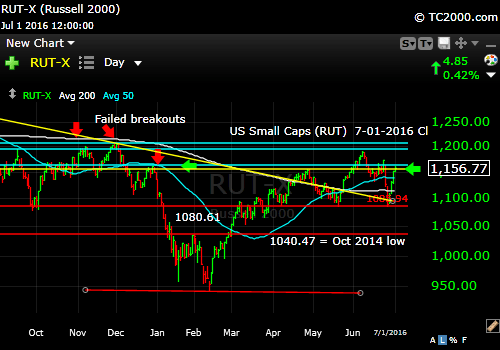
U.S. Small Cap stocks rise to the April high.
3. Gold: Gold continues to serve us well as rates stay very low in the U.S. and foreign rates remain negative. Financial institutions are going to be in deep trouble over time as the entire insurance industry depends on positive rates for survival. If their stock returns go negative, they will be in even worse trouble.
Gold comes with a warning sticker: If the economy begins to improve allowing for a rise in earnings, be careful of being overexposed to gold. Gold makes investors nothing and does not do well against that kind of competition. Rates will rise if the economy improves, which also stiffens competition.
If you did not listen to me back in January, listen now. Don’t buy the rips, buy the dips. And remember the caveat from above: There could be a more substantial pullback in gold, if some of earnings season turns out better than expected.
Gold ETF (click chart to enlarge the chart; GLD):

Gold continues skyward, but be cautious about chasing it. Buy pullbacks.
4. U.S. 10 Year Treasury Note Yield (TNX): We’ve had a bounce off the prior major low, yes, but rates could be pulled still lower as rates abroad drop even more. This is NOT a good thing in the end, because it means that the economy of the world is becoming addicted to easy money and is not growing of its own accord.
That said, don’t think that rates will necessarily correct higher and NOT make brand new lows below the 2012 low. No one thought we’d see negative rates in Europe and we have.
U.S. 10 Year Treasury Note Yield (click chart to enlarge; TNX,TYX,TLT,TBF):

Rates plunge post-Brexit and bounce from 2012 low…for now…
Stay with me throughout the week for the LATEST via the links to Twitter/StockTwits above. Feel free to comment, retweet etc. to spread the word.
Be sure to visit the website for more general investing knowledge at:
Standard Disclaimer: It’s your money and your decision as to how to invest it.
I thank Worden Brothers for the charting system I use to post these charts. If you want to know more about the charting system I use every day, go to my “Other Resources” page here: Other Resources It makes it much easier to follow along with me if you can see the charts and manipulate them on your own computer. It’s a great investment to have an excellent charting system. Check it out with a free trial at the link above.
Note that the newsletter is now CLOSED to new subscriptions: Join the Wait List to Join the Newsletter as a Loyal Subscriber, Opening again for the July 3rd issue. If you join and don’t read the newsletter, you will be deleted. Why? I don’t publish to non-readers as other newsletters do. I surround myself with committed people who value what we are doing. Stay tuned here in the meantime and follow all the action via the Twitter® and StockTwits® links above.
Copyright © 2016 By Wall Street Sun and Storm Report, LLC All rights reserved.
