A Market Timing Report based on the 7-29-2016 Close, published Sunday July 31th, 2016
I deliver focused comments on the markets. These are supplemented with “Tweets/StockTwits” (see links below).
UPDATE 8-02-2016: Stocks Slip
I closed out my Russell 2000 Index small cap short fairly close to the bottom today at 119.22 (low was 119.10), close enough. It is not that I don’t expect a greater pullback; it is that I am trading a short against buying strength/weakness and my signals said to cover. It is definitely an art, but the signals help to get me into the ballpark frequently (not always).
Here is what the break in the SPY looked like today. We fell to the bottom of the recent consolidation band, so the next break could be bigger. I realize it’s hard to see on the right exactly where we are, but the close was JUST ABOVE that top red line. If this support does not hold, the next support is the band of support lines that span the range of about 211 to 212.5. (those lower three closely spaced red lines that are almost blurred together):

SP500 Index breaks support.
…now back to my recent report…
1. SP500 Index: Please read my update made in the prior issue about the Fed statement. I won’t repeat that here.
You cannot use market timing safely until you figure out the economy. Not safely, and not intelligently either. The Bureau of Economic Analysis (BEA) which announced a first estimate of Q2 GDP that was 1.2% vs. the 2.6% expected per Bloomberg News has been playing with the books, just as many companies play with Non-GAAP vs. GAAP earnings, the latter of which takes all charges into account, while the former does not. If a company decides it will take a charge on a bad investment, it can basically hide the error by including it in the non-GAAP earnings number. There are other expenditures that reduce earnings temporarily, but which result in increased sales and earnings down the road. That’s fine, but it’s important to know where a company screwed up.
In a similar way the BEA decided to use a small deflator when GDP was weaker in Q1 and now use a larger deflator in Q2 when GDP was on the hot side, thereby smoothing out the results. It makes it tough to predict what the market’s reaction to a given economic number will be when the books are cooked in this way. Some contend that Q1 would have been recessionary (the first quarter of two required for the formal definition of recession) had the proper deflator been used.
Here are the important numbers:
Remember that GDP is the seasonally adjusted annualized rate of growth of the economy. It is an attempt to project the current rate of growth forward for a year. “Real” means inflation adjusted and that is the big number that is always reported first. Current dollar (non-inflation adjusted) GDP was 3.5% in Q2 2016 vs. real GDP of 1.2%, while Q1 was revised to 1.3% in current dollars vs 0.8% real GDP. The ratio between real GDP vs. current dollar GDP in Q1 vs. Q2 showed a HUGE difference: 0.34 now vs. 0.62 then. In other words, GDP was “marked down” by inflation much more for Q2 than was done in Q1.
The excuse is that they claim inflation shot up in Q2 vs. Q1: “The price index for gross domestic purchases increased 2.0 percent in the second quarter, compared with an increase of 0.2 percent in the first.”
If you are going to do market timing, you must also understand other key numbers the Fed follows. What about Dr. Yellen’s favorite inflation measure? “The PCE price index increased 1.9 percent [in Q2], compared with an increase of 0.3 percent [in Q1]. Excluding food and energy prices, the PCE price index increased 1.7 percent [in Q2], compared with an increase of 2.1 percent [in Q1].” This tells you that it is likely the wild swings in gas prices are part of a legitimate excuse but don’t you think Wall Street can also do the math on inflation? Beyond conspiracy theory, we can say:
- Inflation is running a bit hot but cooled somewhat EX-food and energy going into Q2. Federal Reserve Chair Janet Yellen is most impressed by that as she believes food and energy pressures are “transitory.” We have to pay the difference, but it’s transitory.
- GDP is trending down and has been since 2014 when it peaked (see graph just below). If the slowing continues, we’ll end up in at least a mild recession and sorry to say, that is when stocks would definitely be hit hard. So that is the risk.
- If things continue to trend back up from the GDP basement, the stock market could just work higher as we continue with a “Muddle Through Economy” as I’ve been calling it.
- The initial reaction was “Bad is OK.” It was very tentative, up just a bit and not convincingly for a “window dressing” day, which is what happens on the last day of the trading month. Monday will give us the next direction of the market.
- Based on market value, there is risk to the downside as in a correction, but based on sentiment (See below) and my “Muddle Through Scenario,” the market can work higher still before correcting.
- What I am looking for based on prior sentiment patterns and the current slightly overpriced market in the face of weak GDP is:
- A correction of 5-10%, EVEN if the market goes a bit higher from here (up to 5%). At the minimum, I expect all the gains to be wiped out if the market works immediately higher.
- After A is completed, I expect a stronger market recovery that takes the market to new all time highs and a return of 10% or more above the prior highs.
- If we go into recession, forget B. We’ll easily have a pullback of 15-25% or more depending on the depth of the recession.

The BEA Stats for the PRIOR Quarter (from BEA):
                                         First Quarter 2016
                                Previous Estimate       Revised
                            (Percent change from preceding quarter)
Real GDP                               1.1                0.8
Current-dollar GDP                     1.4                1.3
Real GDI                               2.9                0.9
Average of GDP and GDI                 2.0                0.9
Gross domestic purchases price index   0.2                0.2
PCE price index                        0.2                0.3
SP500 Large Cap Index (click chart to enlarge; SPX, SPY):

Market in levitation. Follow the next move!
Survey Says! Sentiment this week among retail investors (AAII.com) showed a Bull minus Bear percentage spread that went down even more than last week +2.84% [over 40% Neutrals is Bullish for market timing 6 months out]). At these levels there is plenty of room for sentiment to go in either direction, BUT the neutrals have the ball for the 6 month point. The odds according to AAII’s data of the market being higher in 6 months is better than 80%.
| 7-28-16 12 am CT close to poll | Bulls 31.25% | Neutrals 40.34% | Bears 28.41% |
It seems popular right now that the market is going to go down a bit and then rally later on perhaps after the election. Instead of guessing we will follow the market!
Please keep up to date at Twitter and StockTwits: See my messages on Twitter® Follow Me on Twitter®. Follow Me on StockTwits®).
2. U.S. Small Caps: Small caps moved a bit higher against my short position, but failed to make a new high at the end of the week. I still believe they will underperform large caps in the slower economy.
Russell 2000 U.S. Small Cap Index (click chart to enlarge; RUT, IWM):
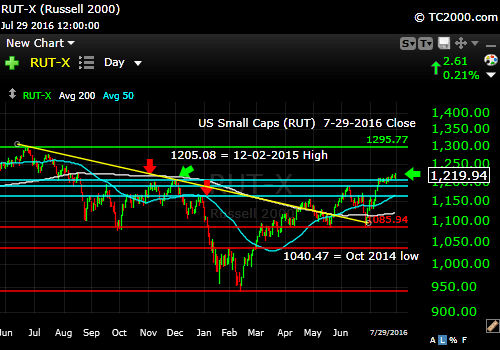
Small cap stocks hold up at new recent highs.
3. Gold: I bought more gold on the pullback as said and trimmed some mining exposure a bit early prior. I did book a healthy profit on GDX and a miner option combination. Fortunately, I kept my GLD.
Remember that gold will have problems if one of TWO things happens:
- IF the Fed raises rates as employment improves and inflation rises toward their 2% target (this Friday is the next employment report) OR
- IF GDP rises from the slowdown of the past few quarters. The trend is down as the chart above shows, but if growth ticks up rather than down for a second quarter in a row “Muddle Through” wins over recession. In other words, if we don’t go into a true recession, but rather, we recover from a temporary mild slowdown with rising earnings. Gold hates economic strength and lower economic risk for stocks unless inflation is substantial (inflation dropped a bit during the last quarter vs. Q1).
Gold ETF (click chart to enlarge the chart; GLD):

Gold bounces nicely from our “add.”
4. U.S. 10 Year Treasury Note Yield (TNX): U.S. 10 Year Treasury Note Yield (click chart to enlarge; TNX,TYX,TLT,TBF): The 10 year yield broke back below 1.567%. This is very bad for the banks and insurers. Avoid them. Rates are going to stay low for many months most likely. That does not mean there is no “rate risk” to bonds. The rubber band is stretched to the downside. My opinion is that negative rates would be a horrible idea.

Rates plunge on weak GDP, much worse than expected.
Stay with me throughout the week for the LATEST via the links to Twitter/StockTwits above. Feel free to comment, retweet etc. to spread the word.
Be sure to visit the website for more general investing knowledge at:
Standard Disclaimer: It’s your money and your decision as to how to invest it.
I thank Worden Brothers for the charting system I use to post these charts. If you want to know more about the charting system I use every day, go to my “Other Resources” page here: Other Resources It makes it much easier to follow along with me if you can see the charts and manipulate them on your own computer. It’s a great investment to have an excellent charting system. Check it out with a free trial at the link above.
Note that the newsletter is now CLOSED to new subscriptions: Join the Wait List to Join the Newsletter as a Loyal Subscriber, Opening again for the October 2nd issue. If you join and don’t read the newsletter, you will be deleted. Why? I don’t publish to non-readers as other newsletters do. I surround myself with committed people who value what we are doing. Stay tuned here in the meantime and follow all the action via the Twitter® and StockTwits® links above.
Copyright © 2016 By Wall Street Sun and Storm Report, LLC All rights reserved.
