A Market Timing Report based on the 10-14-2016 Close, published Sunday October 16th, 2016
I deliver focused comments on the markets. These are supplemented with “Tweets/StockTwits” (see links below).
UPDATE 10-21-2016: Election Vibes Continue – The yellow lines are the same lines shown in the chart just below this one. We’ve tested the top and bottom of the range set up on September 12th! It’s now October 21st!
The BIG number coming is on October 28th, which is the government’s 1st estimate of 3rd Quarter Real GDP, which estimates the growth of the economy on a seasonally adjusted annualized basis for the coming year. “Real” means adjusted for inflation, and some have claimed that the GDP deflator that makes this adjustment has been liberally “played with” by the Bureau of Economic Analysis, which is part of the Dept. of Commerce, which is of course, part of the Executive Branch of the U.S. government, which is lead by the President.
Guess whether they want to see a falling GDP number just before the election. Hint, hint…
Here is the 15 minute chart updated at 11:34 am, Friday.
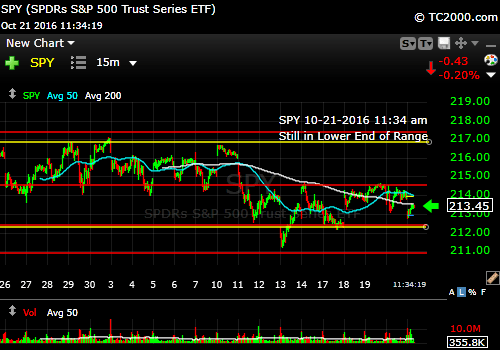
SPY in lower end of vibrational range.
Now continuing with this week’s issue…
1. SP500 Index: Retail sales met expectations this past Friday at +0.6% month over month, but were up only 0.3% minus auto and gas sales. The banks beat earnings expectations on Friday, even the troubled Wells Fargo, but other companies may not do quite as well.
Overall, earnings per data company FactSet are expected to show a drop of 2.1–2.3% from a year ago as reported HERE. This would be a long dry spell for rising earnings if it occurs; it would be the SIXTH quarterly drop in year/year earnings. This is not a strong economy despite the Federal Reserve’s misunderstanding. The Atlanta Fed has a GDP estimate up on their website that is 1.9% as of last Friday. That’s down from their 3.6% estimate at the beginning of August, a pretty big change. I suspect it will come out even lower when we get the first official estimate on Oct. 28th.
SP500 Large Cap Index (click chart to enlarge; SPX, SPY):

SP500 Index stuck in the “Vibrational Range’ set up on 9-12-2016.
Keep up to date during the week at Twitter and StockTwits, where a combined 20,895 people are joining in. Thank you for your interest!
Twitter® Follow Me on Twitter®. Follow Me on StockTwits®).
Survey Says! Sentiment this week among individual investors (AAII.com) showed a Bull minus Bear percentage spread that was -8.26, or mildly Bearish in the midst of the recent election uncertainty. The percentage of “Neutrals” is still above 40% this week (above 40% Neutrals is Bullish on a market timing basis for higher prices out 6 months from today per AAII studies of their statistics).
| 10-13-16 12 am close to poll | Bulls 25.47% | Neutrals 40.80% | Bears 33.73% |
2. U.S. Small Caps:
As I’ve said recently and repeatedly over the past several months, I prefer midcaps and large caps at this time, although they also are not cheap vs. their earnings, which have declined over the past year, as just discussed.
My prior warning holds: Be careful to exit your weak holdings for all market caps before earnings are reported. They will be severely punished.
Russell 2000 U.S. Small Cap Index (click chart to enlarge; RUT, IWM):
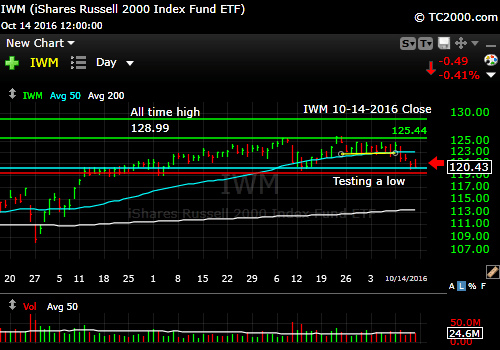
Small caps testing a low.
3. Gold: The dollar has maintained a breakout, which is trouble for gold denominated in US dollars. It must hold the current price level, or we’ll drop to the April/June lows. Rate hike fears mean a higher US dollar, which pressures gold priced in USD. Gold buying in other currencies can help out, but when it’s being bought in several major currencies, it does best, as explained HERE.
Gold ETF (click chart to enlarge the chart; GLD):
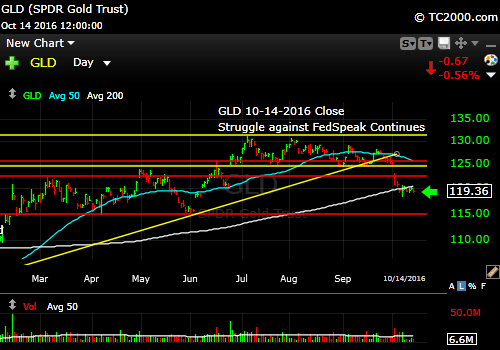
Gold slump in face of higher rates.
4. U.S. 10 Year Treasury Note Yield (TNX):
The equation was explained above. We have a rate breakout, a dollar breakout to go with it, and a breakdown in gold and stocks. Rising rates only work in a more rapidly growing economy. The Federal Reserve will likely have to reverse their rhetoric to dovish once again! They are not even politicians, but they change their mind more often than politicians. They are unelected misguided economists in control of the free world’s economy, along with the other misguided Central Bankers.
U.S. 10 Year Treasury Note Yield (click chart to enlarge; TNX,TYX,TLT,TBF):
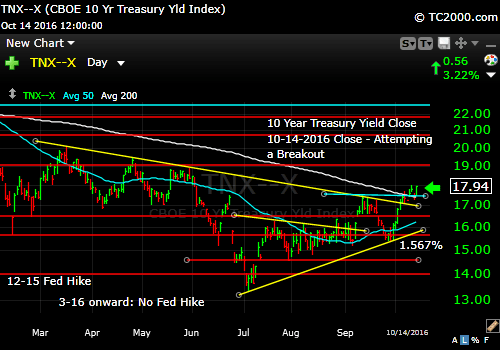
10 Year Treasury Yield attempting a breakout.
Stay with me throughout the week for the LATEST via the links to Twitter/StockTwits above. Feel free to ask me questions, comment, retweet etc.
Note that ALTHOUGH my newsletter is now CLOSED to new subscriptions: You can Join the Wait List to Receive the Newsletter as a Loyal Subscriber, Opening again for the January 1st issue. Note that if you join and don’t read the newsletter, you will be deleted. Why? I don’t publish to non-readers as other newsletters do. I surround myself with committed people who value what we are doing. Stay tuned here in the meantime and follow all the action via the Twitter® and StockTwits® links above.
Be sure to visit the website for more general investing knowledge at:
Standard Disclaimer: It’s your money and your decision as to how to invest it.
I thank Worden Brothers for the charting system I use to post these charts. If you want to know more about the charting system I use every day, go to my “Other Resources” page here: Other Resources It makes it much easier to follow along with me if you can see the charts and manipulate them on your own computer. It’s a great investment to have an excellent charting system. Check it out with a free trial at the link above.
Copyright © 2016 By Wall Street Sun and Storm Report, LLC All rights reserved.
